Stacked Bar Chart
- 5 minutes to read
Short Description
The Stacked Bar Chart is represented by the StackedBarSeriesView object, which belongs to Bar Series Views. This view displays all the points of its series. Series values are stacked at arguments included in multiple series. So, the height of each bar is determined by the total of all the series values for the category.
A Stacked Bar chart is shown in the image below. Note that this chart type is based upon the XYDiagram, and so it can be rotated to show bars either vertically or horizontally.
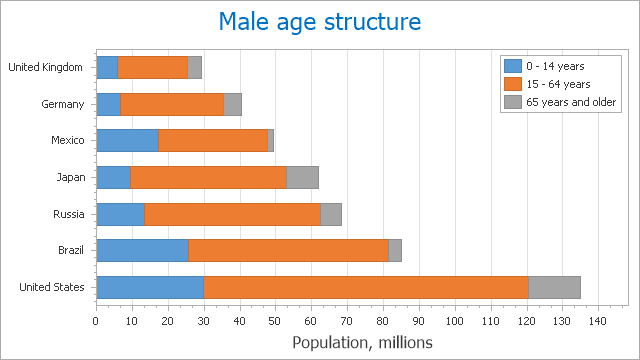
Chart Type Characteristics
The table below lists the main characteristics of this chart type.
| Feature | Value |
|---|---|
| Series View type | StackedBarSeriesView |
| Diagram type | 2D-XYDiagram |
| Number of arguments per series point | 1 |
| Number of values per series point | 1 |
Note
For information on which chart types can be combined with the Stacked Bar Chart, refer to the Series Views Compatibility document.
Example
This example shows how to bind a chart control to a data source and create two Stacked Bar series based on a series template.

Add a chart to the WinForms project and specify the chart’s data source.
Use the ChartControl.SeriesTemplate property to access and configure series template options:
- Call the ChangeView(ViewType) method to specify the view type of generated series.
- Specify the SeriesDataMember property to define a data member that stores names for generated series.
- Call the SetDataMembers(String, String) method to define data members that store point arguments and values.
Define the BarWidth property to specify the width of stacked bars in x-axis units.
Use the x-axis’ Tickmarks property to access and configure tickmark settings. This example shows how to disable x-axis minor tickmarks.
Add a title on the chart.
Customize the chart legend. This example enables legend check boxes to allow users to hide and show series, and specifies the legend position.
using System;
using System.Collections.Generic;
using System.Windows.Forms;
using DevExpress.XtraCharts;

namespace Series_StackedBarChart {
    public partial class Form1 : Form {
        public Form1() {
            InitializeComponent();
        }
        private void Form1_Load(object sender, EventArgs e) {

            // Create a chart and add it to the form:
            ChartControl chart = new ChartControl();
            chart.Dock = DockStyle.Fill;
            this.Controls.Add(chart);

            // Bind the chart to a data source:
            chart.DataSource = DataPoint.GetDataPoints();
            chart.SeriesTemplate.ChangeView(ViewType.StackedBar);
            chart.SeriesTemplate.SeriesDataMember = "Company";
            chart.SeriesTemplate.SetDataMembers("Product", "Income");

            // Enable series point labels, specify their text pattern and position:
            chart.SeriesTemplate.LabelsVisibility = DevExpress.Utils.DefaultBoolean.True;
            chart.SeriesTemplate.Label.TextPattern = "${V}M";
            ((BarSeriesLabel)chart.SeriesTemplate.Label).Position = BarSeriesLabelPosition.Center;

            // Customize series view settings (for example, bar width):
            StackedBarSeriesView view = (StackedBarSeriesView)chart.SeriesTemplate.View;
            view.BarWidth = 0.8;

            // Disable minor tickmarks on the x-axis:
            XYDiagram diagram = (XYDiagram)chart.Diagram;
            diagram.AxisX.Tickmarks.MinorVisible = false;

            // Add a chart title:
            chart.Titles.Add(new ChartTitle { Text = "Sales by Products" });

            // Specify legend settings:
            chart.Legend.MarkerMode = LegendMarkerMode.CheckBoxAndMarker;
            chart.Legend.AlignmentHorizontal = LegendAlignmentHorizontal.Center;
            chart.Legend.AlignmentVertical = LegendAlignmentVertical.TopOutside;

        }

        public class DataPoint {
            public string Product { get; set; }
            public double Income { get; set; }
            public string Company { get; set; }
            public DataPoint(string product, double income, string company) {
                this.Product = product;
                this.Income = income;
                this.Company = company;
            }
            public static List<DataPoint> GetDataPoints() {
                List<DataPoint> data = new List<DataPoint> {
                new DataPoint("Camera",      34.96,  "DevAV North"),
                new DataPoint("Camcorder",   56.26,  "DevAV North"),
                new DataPoint("Flash",       45.982, "DevAV North"),
                new DataPoint("Smartphone",  67.14,  "DevAV North"),
                new DataPoint("Smart Watch", 51.23,  "DevAV North"),
                new DataPoint("Television",  57.443, "DevAV North"),
                new DataPoint("Home Audio",  45.83,  "DevAV North"),
                new DataPoint("Headphone",   51.23,  "DevAV North"),

                new DataPoint("Camera",      56.48,  "DevAV South"),
                new DataPoint("Camcorder",   35.123, "DevAV South"),
                new DataPoint("Flash",       36.16,  "DevAV South"),
                new DataPoint("Smartphone",  39.1,   "DevAV South"),
                new DataPoint("Smart Watch", 34.6,   "DevAV South"),
                new DataPoint("Television",  56.16,  "DevAV South"),
                new DataPoint("Home Audio",  35.38,  "DevAV South"),
                new DataPoint("Headphone",   58.1 ,  "DevAV South")};
                return data;
            }
        }
    }
}
Note
If you want to bind individual series to a data source, refer to the following help topic for more information: Specify Series Data Members.