Trend Lines
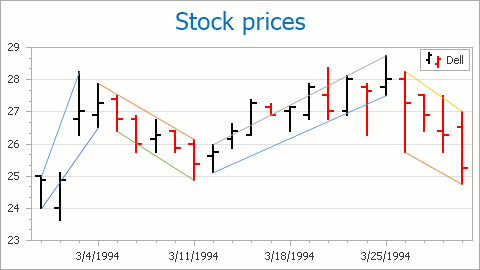
Trend Line is a line drawn between any two points of a series to show the general direction that values are headed in. It can be limited by these two points or extrapolated to infinity.
Along with other indicators, Trend Lines reside in the XYDiagram2DSeriesViewBase.Indicators collection of a series. A series may have any number of Trend Lines. For more information refer to Trend Lines.
The table below lists the main properties that affect the element’s functionality and appearance.
Class | The TrendLine class (which is a descendant of the Indicator class) |
Availability | |
Points | |
Argument and Value Level | FinancialIndicatorPoint.Argument and FinancialIndicatorPoint.ValueLevel |
Specific Options | TrendLine.ExtrapolateToInfinity, TrendLine.ExtrapolateToNegativeInfinity |
Appearance | ChartControl.IndicatorsPaletteName, Indicator.Color and Indicator.LineStyle |
Visibility and Legend Availability | Indicator.Visible, Indicator.ShowInLegend, and Indicator.CheckedInLegend |