Add Points to a Series Manually
This document describes how to populate a series with data points manually.
This approach to creating points is used when the number of points is relatively small. If you wish to learn about an alternative approach, refer to Bind a Series to a Data Source.
After you manually create a series, it is not displayed unless it has at least two data points.
A series points collection is easily managed via the Collection Editor: Points, which is invoked by choosing a series and clicking the ellipsis button for its Series.Points property.
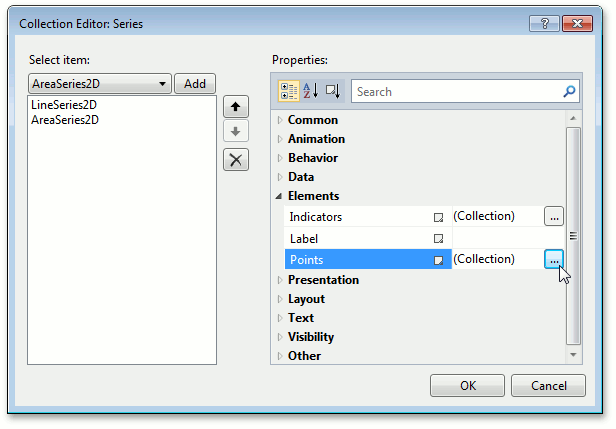
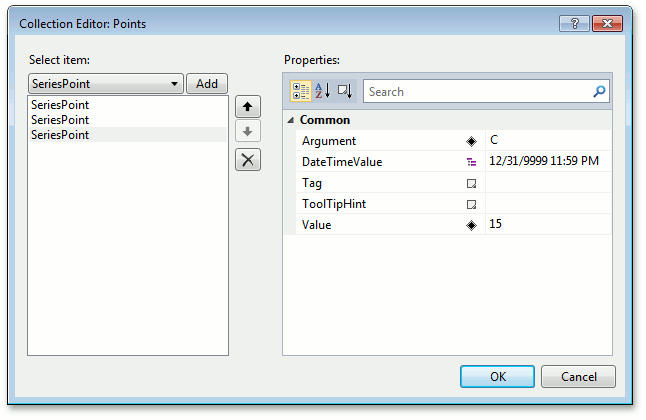
In this dialog, click Add to create a series point. Then specify the point’s argument and value via the SeriesPoint.Argument and SeriesPoint.Value properties.
After that, your XAML may look like the following:
<Window x:Class="WpfApplication.MainWindow"
        xmlns="http://schemas.microsoft.com/winfx/2006/xaml/presentation"
        xmlns:x="http://schemas.microsoft.com/winfx/2006/xaml"
        Title="MainWindow" Height="350" Width="525"
        xmlns:dxc="http://schemas.devexpress.com/winfx/2008/xaml/charts">
    <Grid>
        <dxc:ChartControl>
            <dxc:XYDiagram2D>
                <dxc:XYDiagram2D.Series>
                    <dxc:LineSeries2D>
                        <dxc:LineSeries2D.Points>
                            <dxc:SeriesPoint Argument="A" Value="7" />
                            <dxc:SeriesPoint Argument="B" Value="12" />
                            <dxc:SeriesPoint Argument="C" Value="17" />
                        </dxc:LineSeries2D.Points>
                    </dxc:LineSeries2D>
                    <dxc:AreaSeries2D>
                        <dxc:AreaSeries2D.Points>
                            <dxc:SeriesPoint Argument="A" Value="4" />
                            <dxc:SeriesPoint Argument="B" Value="11" />
                            <dxc:SeriesPoint Argument="C" Value="15" />
                        </dxc:AreaSeries2D.Points>
                    </dxc:AreaSeries2D>
                </dxc:XYDiagram2D.Series>
            </dxc:XYDiagram2D>
        </dxc:ChartControl>
    </Grid>
</Window>
See Also