Create a Series Manually
- 2 minutes to read
This document describes how you can add new series to your chart.
To customize an individual series, add them to the diagram‘s collection, returned by the Diagram.Series property.
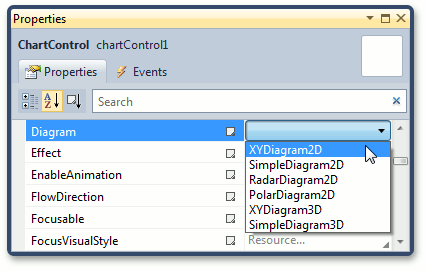
To quickly create series at design time within Visual Studio, you should first choose the diagram type. To do this, select your chart and expand the drop-down menu for the ChartControl.Diagram property in the Properties window.
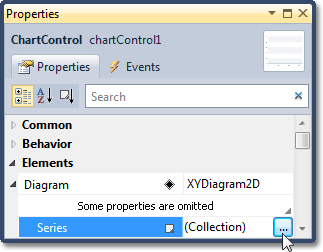
Next, expand the ChartControl.Diagram property and click the ellipsis button for the Diagram.Series property.
In the invoked Series Collection Editor, select the required series type.
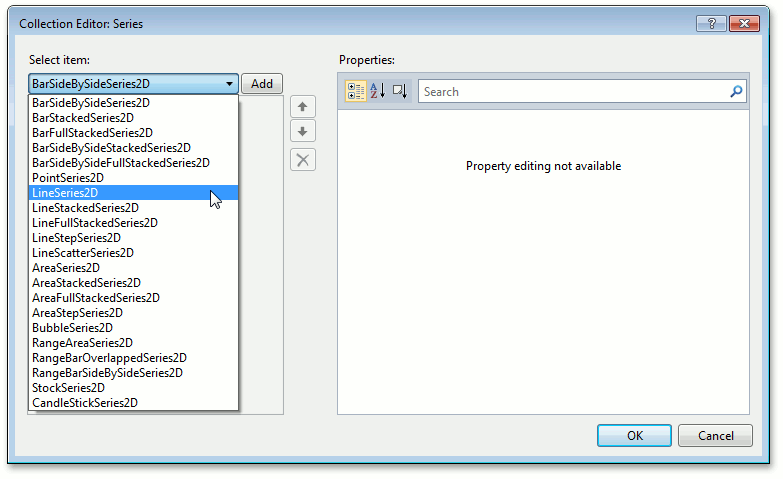
After a series is created, you can adjust the options listed in the dialog’s Property Grid. In these options, be sure to specify the Series.ValueScaleType property properly, because it determines how the chart will interpret the data defined for the series points’ values.
Note
You do not need to specify the Series.ArgumentScaleType property (set to the Auto mode, by default) because the type of series points’ arguments is detected automatically based on the type of underlying data.
A series will not be displayed until it has at least two data points. There are two approaches to creating series points.
- add points to a series collection manually, with point arguments and values specified individually;
- specify a series data source, based on which, a series is populated automatically.