ChartSeries.PlotOnSecondaryAxis Property
Gets or sets a value indicating whether to plot series using the secondary axis.
Namespace: DevExpress.DashboardCommon
Assembly: DevExpress.Dashboard.v26.1.Core.dll
Declaration
Property Value
| Type | Default | Description |
|---|---|---|
| Boolean | false | true, to plot series using the secondary axis; otherwise, false. |
Remarks
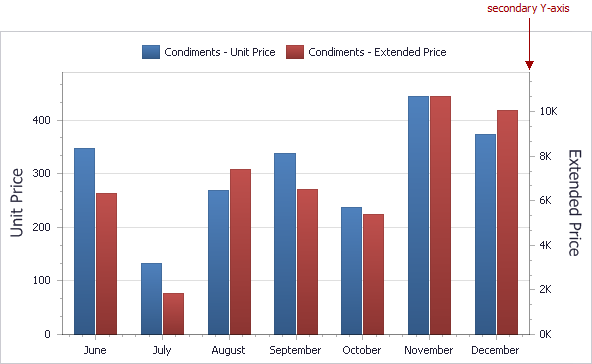
Set the PlotOnSecondaryAxis property to true to plot series using the secondary axis. For instance, the following code snippet shows how to plot series point values using the secondary Y-axis.
SimpleSeries salesAmountSeries = new SimpleSeries(SimpleSeriesType.Bar);
salesAmountSeries.Value = new Measure("Extended Price");
salesAmountSeries.PlotOnSecondaryAxis = true;
Related GitHub Examples
The following code snippets (auto-collected from DevExpress Examples) contain references to the PlotOnSecondaryAxis property.
Note
The algorithm used to collect these code examples remains a work in progress. Accordingly, the links and snippets below may produce inaccurate results. If you encounter an issue with code examples below, please use the feedback form on this page to report the issue.