Manhattan Bar
Short Description
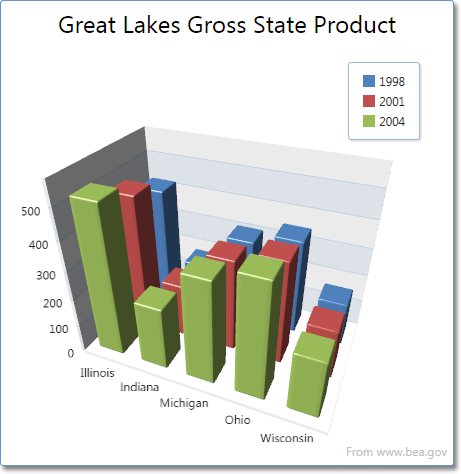
The Manhattan Bar series is useful to display series of individual bars, grouped by category. The height of each bar is determined by the series value. In addition, the 3D look makes it possible to rotate a chart to position bars in an attractive and easy-to-understand way.
An example of the Manhattan Bar chart is shown in the image below.
Series Characteristics
The table below lists the main characteristics of this chart type.
| Feature | Value |
|---|---|
| Series View type | BarSeries3D |
| Diagram type | XYDiagram3D |
| Number of arguments per series point | 1 |
| Number of values per series point | 1 |
For information on which series view types can be combined with the Manhattan Bar view, refer to the Series Type Compatibility document.
Example
The following example demonstrates how to create a 3D Manhattan Bar chart.