TdxChartXYDiagramToolTipOptions Class
Stores XY diagram tooltip settings.
Declaration
TdxChartXYDiagramToolTipOptions = class(
    TdxChartDiagramToolTipOptions
)
Remarks
Tooltip functionality allows users to interact with diagrams and display additional information on individual data points. XY diagrams support two tooltip display modes:
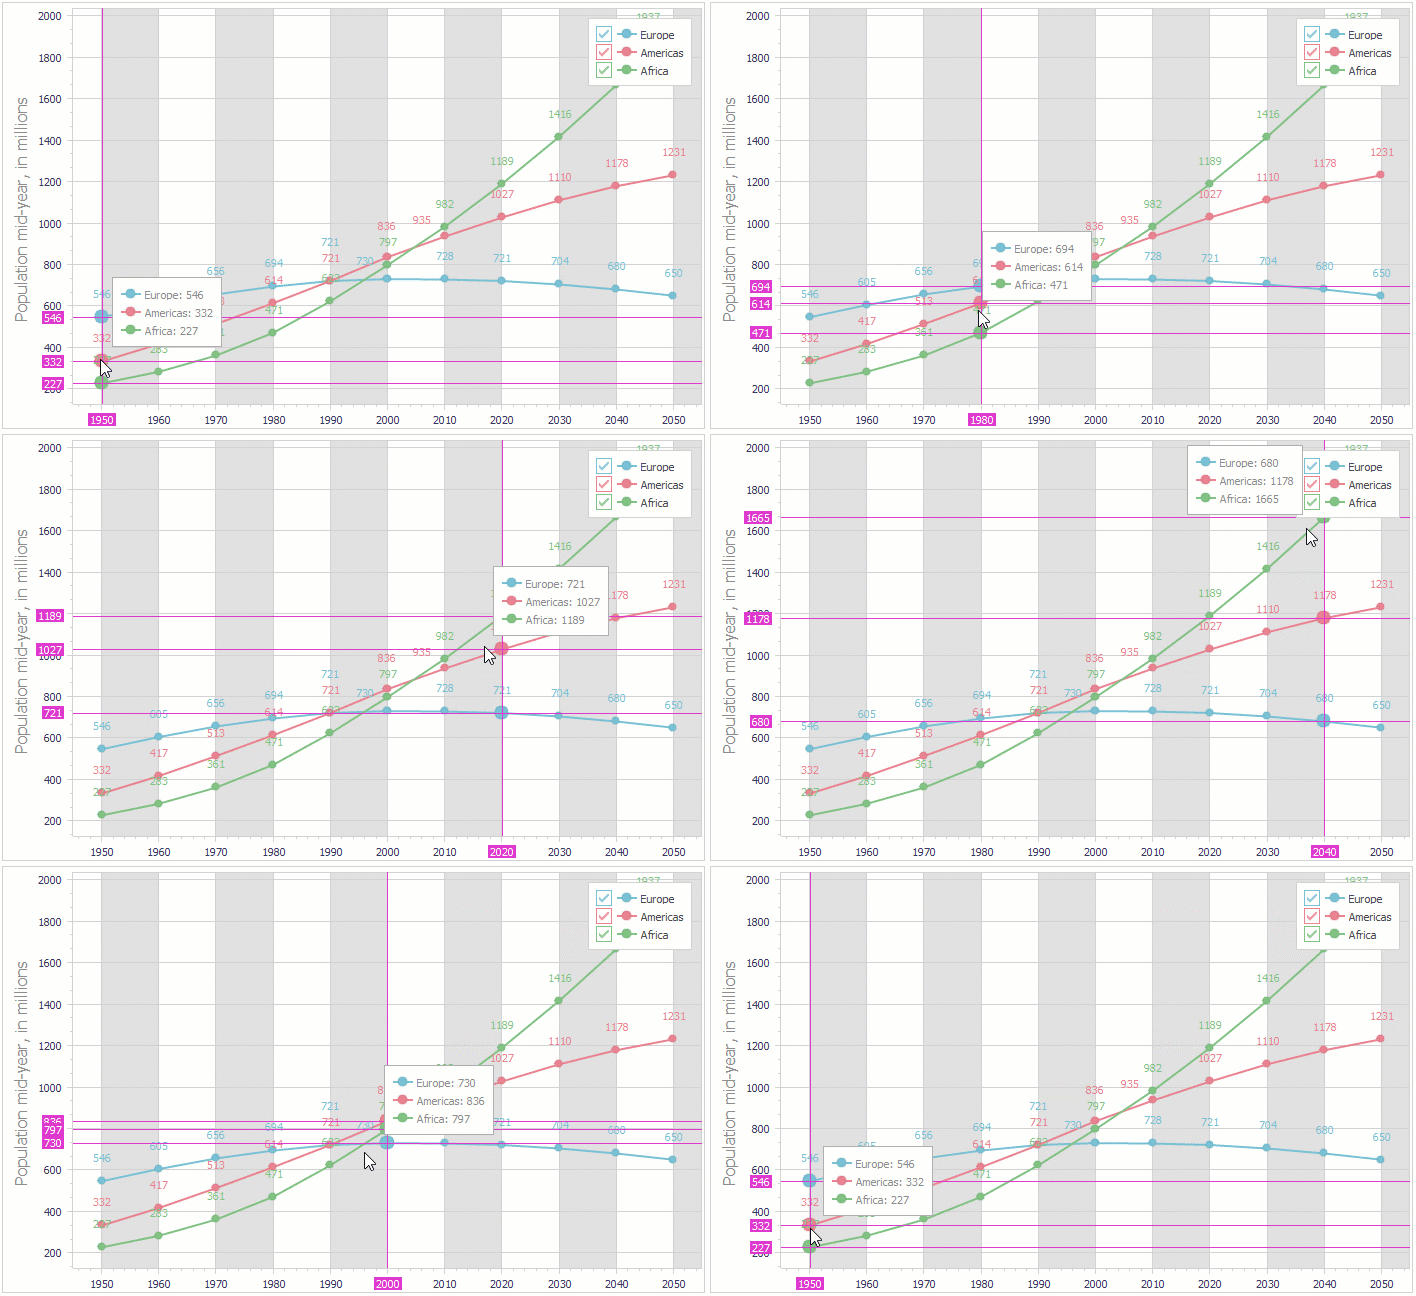
- Crosshair Cursor
Crosshair Cursor consists of a crosshair label that displays additional information on target series points, crosshair lines that mark positions of target series points within an XY diagram area, and axis labels that help users track coordinates of the target points. You can independently hide or display any Crosshair Cursor elements.

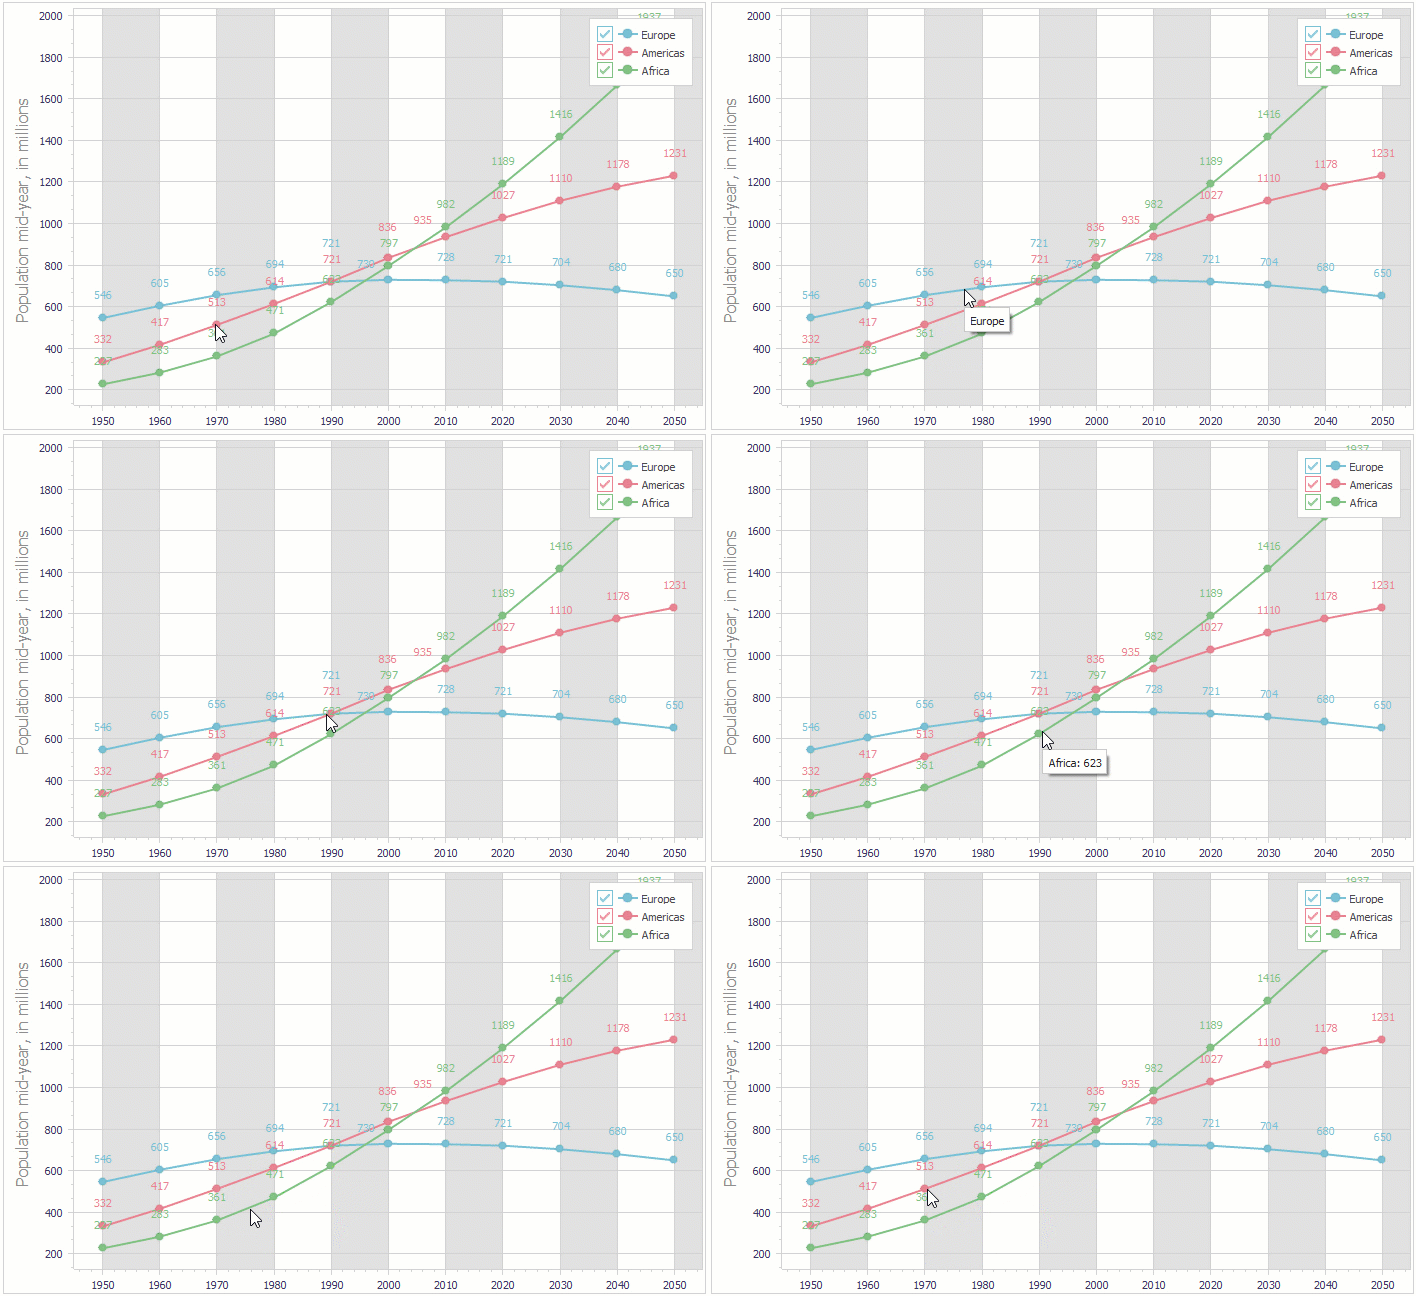
- Simple Tooltips
This mode displays a simple tooltip for a series and/or its points depending on the Chart control’s ToolTips.SimpleToolTipOptions.ShowForPoints and ToolTips.SimpleToolTipOptions.ShowForSeries property values.

You can define series and series point tooltip settings at the diagram level. Corresponding tooltip settings at the level of individual settings have higher priority.
Main API Members
The list below outlines key members of the TdxChartXYDiagramToolTipOptions class that allow you to customize tooltip-related settings at the diagram level.
- PointToolTipFormat | SeriesToolTipFormat
- Define custom formatting patterns for all series in an XY diagram.
- Mode
- Allows you to switch between available tooltip display modes in an XY diagram.
- Assign
- Copies tooltip settings between diagrams.
Direct TdxChartSimpleDiagramToolTipOptions Class Reference
The TdxChartXYDiagram.ToolTips property references a TdxChartSimpleDiagramToolTipOptions object.