VCL Chart Hints and Tooltips
- 3 minutes to read
Tooltips allow users to interact with diagrams and obtain additional information on data points, such as series arguments, values, captions, etc. Tooltips are particularly useful when the Chart area is constrained and does not fit all necessary details.

Available Tooltip Types
- Simple Tooltips
Simple tooltips display a series caption and/or a series point value when a user hovers the mouse pointer over a series or series point. Simple tooltips are available in all diagram types and support the same text formatting patterns as value labels.

- Crosshair Cursor
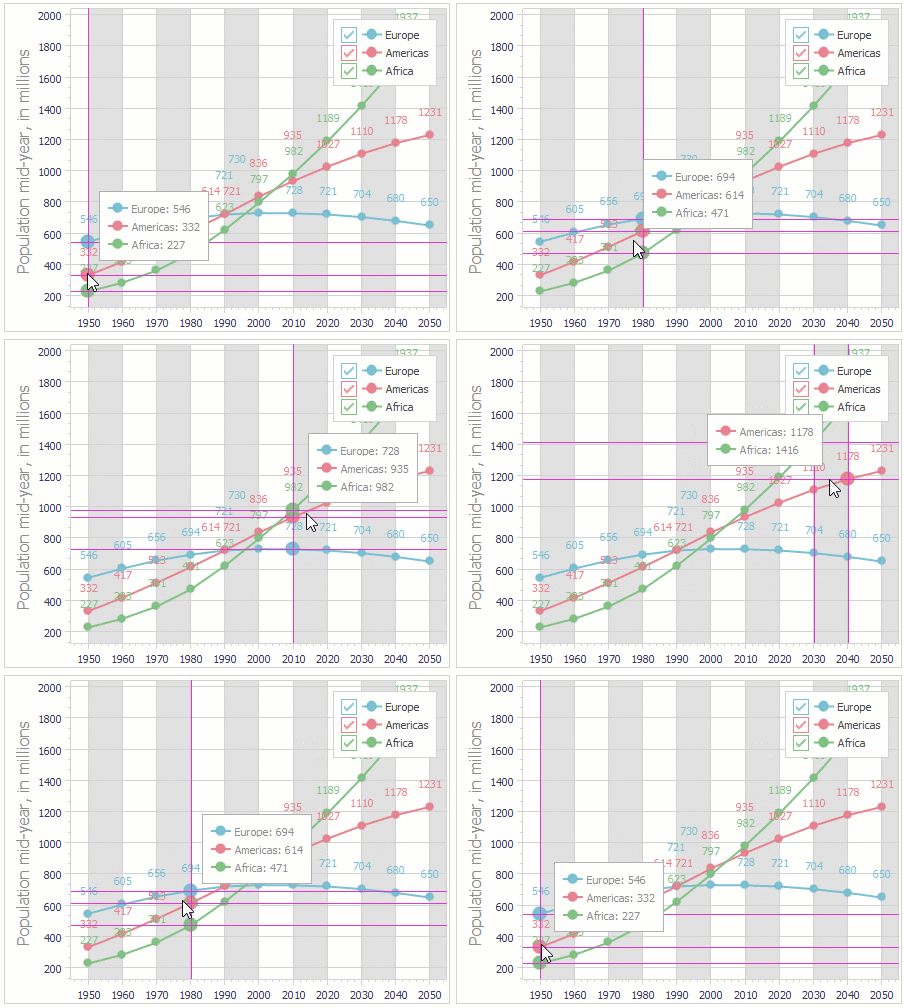
Crosshair Cursor is an advanced tooltip that targets one or multiple series points in an XY diagram and displays additional information on them in a label similar to a diagram legend pane.
In addition, you can display crosshair lines and axis labels to help users track the coordinates (in axis measurement units) of target points or the current mouse pointer position. You can hide or display all Crosshair Cursor elements in any combination as well as customize their appearance and behavior.

Tooltip Display Mode Settings
The Chart control allows you to define active tooltip display modes at the following levels:
- Global
The Chart control’s ToolTips.DefaultMode property specifies the tooltip display mode applied to all visible diagrams with default tooltip mode settings. The tooltip functionality is initially disabled.
You can set this property to TdxChartToolTipMode.Crosshair or TdxChartToolTipMode.Simple to enable the Crosshair Cursor or simple tooltips at the Chart control level.
- Diagram
The following properties define the active tooltip display mode at the diagram level and have higher priority than the global tooltip display mode.
- TdxChartSimpleDiagramToolTipOptions.Mode
- Specifies the active tooltip display mode for a simple diagram.
- TdxChartXYDiagramToolTipOptions.Mode
- Specifies the active tooltip display mode for an XY diagram.
Individual Series Settings
You can use the ToolTips.Enabled property of an individual series to disable or enable tooltip functionality for the series.
Related Compiled Demo
To see tooltips in action, run the Chart Control demo in the VCL Demo Center installed with compiled VCL DevExpress demos. Click the Line, Area, or Bar item in the sidebar on the left and hover the mouse pointer over a series in the XY diagram area.
The Options pane on the right has the Tooltips group that contains tooltip-related settings that you can configure. For instance, you can use the Tooltip Mode combo box to switch between simple tooltips and the Crosshair Cursor.
Tip
Compiled DevExpress demos ship with source code installed in the Public Documents folder (%Public%) for all users (default). You can find all project and source code files for the Chart control demo in the following folder:
%Public%\Documents\DevExpress VCL Demos\MegaDemos\Product Demos\ExpressChart