HeatmapControl Class
Displays a customizable and interactive heatmap chart.
Namespace: DevExpress.XtraCharts.Heatmap
Assembly: DevExpress.XtraCharts.v26.1.UI.dll
Declaration
public class HeatmapControl :
    Control,
    IChartContainer,
    IChartRenderProvider,
    IHeatmapInteractionContainer,
    IToolTipControlClient,
    ICursorHolder,
    ISupportLookAndFeel,
    IPrintable,
    IBasePrintable,
    IPrintingTarget,
    IChartInteractionProvider,
    IComponentPrintable,
IComponentExportableRemarks
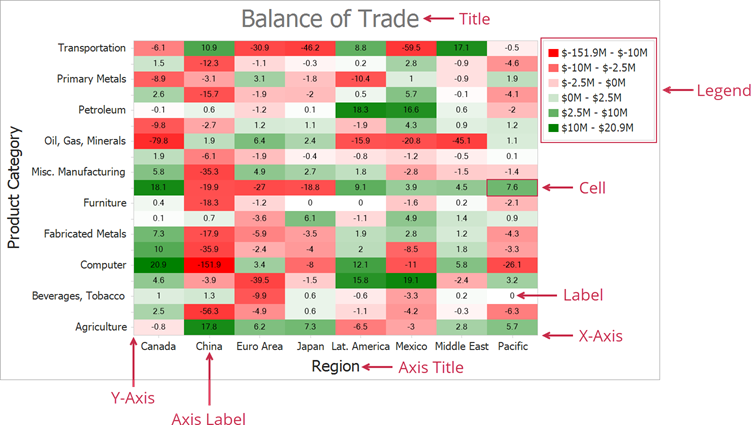
A heatmap is a data analysis tool that uses colors and color intensity to visualize a change in magnitude. Each heatmap cell is defined by three values: X-argument, Y-argument, and Value (Color Value). The arguments are displayed along corresponding axes. The value is used to determine the cell color.
The following image depicts the main elements of a heatmap:
Demos
The Heatmap Control ships with a set of demo applications that you can explore in the DevExpress Demo Center:
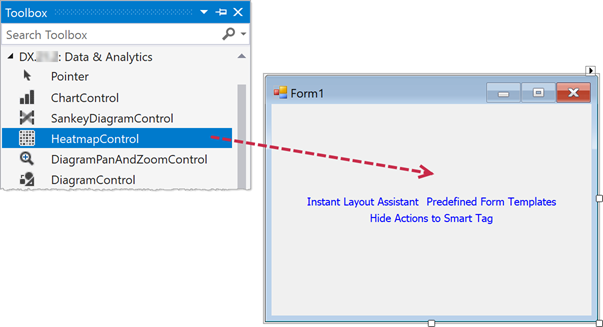
Add a Heatmap Control to the Project
Drag and drop the HeatmapControl component from the Visual Studio Toolbox to the form to add a heatmap chart control to the project.
This adds references to the following assemblies in the project:
- DevExpress.Charts.v26.1.Core.dll
- DevExpress.Data.Desktop.v26.1.dll
- DevExpress.Data.v26.1.dll
- DevExpress.Printing.v26.1.Core.dll
- DevExpress.XtraPrinting.v26.1.dll
- DevExpress.Utils.v26.1.dll
- DevExpress.Utils.v26.1.UI.dll
- DevExpress.XtraBars.v26.1.dll
- DevExpress.XtraCharts.v26.1.dll
- DevExpress.XtraCharts.v26.1.UI.dll
- DevExpress.XtraCharts.v26.1.Wizard.dll
- DevExpress.XtraEditors.v26.1.dll
Load Data to a Heatmap
The Heatmap Control uses data adapters to load data. Heatmap data adapters are derived from the HeatmapDataAdapterBase class. Use the Heatmap Control’s DataAdapter property to assign an adapter to a heatmap. The following adapters are available:
- HeatmapDataSourceAdapter – Allows you to bind the Heatmap Control to a data source.
- HeatmapMatrixAdapter – Allows you to use collections of values to specify x-arguments and y-arguments, and pass a matrix of numeric values to define heatmap cell values.
Paint a Heatmap
The Heatmap Control ships with multiple color providers that implement different coloring algorithms:
- HeatmapKeyColorProvider – Applies colors to heatmap cells based on color values that are used as key values (keys). Cells with equal keys have the same color.
- HeatmapRangeColorProvider – Applies colors based on ranges to which cell values belong.
- HeatmapObjectColorProvider – Applies a color to a cell that is stored in the Color Data Member.
To assign a color provider object to a heatmap, use the HeatmapControl.ColorProvider property.
Note
HeatmapControl does not support the BackgroundImage and BackColor properties.
Add Titles
You can add multiple titles to a heatmap. To do this, add HeatmapTitle objects to the Heatmap Control’s Titles collection.
Configure Cell Labels
Use the HeatmapControl.Label property to access heatmap cell label settings. Enable the HeatmapLabel.Visible property to display labels. Specify the HeatmapLabel.Pattern property to format labels.
Configure Axes
Use the AxisX and AxisY properties to access heatmap axis settings. The Heatmap Control includes the following axis options:
- Alignment - Specifies the title position on the heatmap chart.
- Color - Specifies the color of the axis and its tickmarks.
- Label - Allows you to access axis label settings, such as display format, position, or color.
- CustomLabels - Allows you to replace default axis labels with custom labels.
- GridSpacing - Defines the frequency of axis tickmarks and labels.
- Reverse - Allows you to display axis labels and corresponding rows (columns) in reversed order.
- Thickness - Defines axis thickness.
- Tickmarks - Allows you to access tickmark settings.
- Title - Specifies axis title options.
- Visibility - Specifies whether an axis is visible.
Refer to the HeatmapAxis class description to learn more about axis customization.
Customize Legend
You can display a single legend for a heatmap. Legend item content depends on the color provider assigned to the heatmap. For example, the Range Color Provider generates legend items that show value ranges. To format legend item content, use the color provider’s LegendItemPattern property. Use the Legend property to access legend options, such as position, title, and so on.
Obtain Hit Information about Heatmap Elements
Call the CalcHitInfo method to check what heatmap element is located in the test point. This method returns a HeatmapHitInfo object that contains information about the test point and heatmap element.
Zoom and Scroll Heatmap
Enable the following properties to allow users to scroll and zoom a heatmap:
- HeatmapControl.EnableAxisXScrolling
- HeatmapControl.EnableAxisYScrolling
- HeatmapControl.EnableAxisXZooming
- HeatmapControl.EnableAxisYZooming
You can use the HeatmapControl.Scroll, HeatmapControl.ZoomIn and HeatmapControl.ZoomOut methods to scroll and zoom a heatmap programmatically.
After a heatmap is zoomed, you can call the Heatmap Control’s ResetZoom() method to reset the heatmap to its initial state (not zoomed).
Select Heatmap Cells
Specify the heatmap SelectionMode property to choose a selection mode. The following modes are available: None, Single, Multiple, and Extended. To obtain selected items, use the SelectedItems property. To respond to user selection actions, handle the HeatmapControl.SelectedItemsChanged and HeatmapControl.SelectedItemsChanging events.
Enable and Customize Tooltips
Set the HeatmapControl.ToolTipEnabled property to true to display tooltips when a user hovers over a heatmap cell.
Use the HeatmapControl.ToolTipController property to access tooltip settings.
Specify the HeatmapControl.ToolTipTextPattern property to format tooltip text. For advanced tooltip content customization, handle the HeatmapControl.CustomizeHeatmapToolTip event.
Highlight Heatmap Cells
A user can hover over a heatmap cell with the mouse cursor to highlight this cell. Specify the HeatmapControl.HighlightMode property to select an appropriate highlight mode.
If you want to perform custom actions when a user highlights a heatmap cell, handle the HeatmapControl.HighlightedItemChanged event.
Print and Export Heatmap
Use one of the methods below to print the Heatmap control:
The following methods allow you to export the Heatmap control to different formats:
- ExportToDocx
- ExportToHtml
- ExportToImage
- ExportToMht
- ExportToPdf
- ExportToRtf
- ExportToSvg
- ExportToXls
- ExportToXlsx
Examples
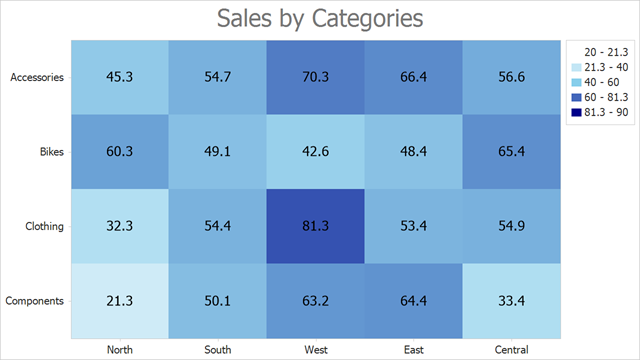
How to Create a Heatmap Based on a Matrix of Numeric Values
This example shows how to use arrays of string and numeric values to create a heatmap.
Follow the steps below to create a heatmap:
- Add the
HeatmapControlto the Form. - Create a HeatmapMatrixAdapter object and assign it to the HeatmapControl.DataAdapter property.
- Use the adapter’s XArguments and YArguments properties to populate the heatmap with x- and y-arguments that are displayed along x- and y-axes.
- Assign a two-dimensional array of double values to the adapter’s Values property.
- Create a HeatmapRangeColorProvider object and assign it to the heatmap’s ColorProvider property. The HeatmapRangeColorProvider paints cells based on a value range to which the cell value belongs.
- Add a HeatmapTitle to the heatmap’s Titles collection. Specify the title’s Text property.
- Use the heatmap’s Label property to configure cell label options. This example shows how to configure label text format.
using DevExpress.XtraCharts;
using DevExpress.XtraCharts.Heatmap;
using System.Drawing;
using System.Windows.Forms;

namespace HeatmapMatrixData {
    public partial class Form1 : Form {
        public Form1() {
            InitializeComponent();

            HeatmapMatrixAdapter dataAdapter = new HeatmapMatrixAdapter();
            dataAdapter.XArguments = new string[] { "North", "South", "West", "East", "Central" };
            dataAdapter.YArguments = new string[] { "Components", "Clothing", "Bikes", "Accessories" };
            dataAdapter.Values = new double[,] {
                { 21.3, 50.1, 63.2, 64.4, 33.4 },
                { 32.3, 54.4, 81.3, 53.4, 54.9 },
                { 60.3, 49.1, 42.6, 48.4, 65.4 },
                { 45.3, 54.7, 70.3, 66.4, 56.6 }
            };
            heatmap.DataAdapter = dataAdapter;

            Palette palette = new Palette("Custom") {
                Color.White,
                Color.SkyBlue,
                Color.DarkBlue
            };

            HeatmapRangeColorProvider colorProvider = new HeatmapRangeColorProvider() {
                Palette = palette,
                ApproximateColors = true
            };
            colorProvider.RangeStops.Add(new HeatmapRangeStop(0, HeatmapRangeStopType.Percentage));
            colorProvider.RangeStops.Add(new HeatmapRangeStop(20, HeatmapRangeStopType.Absolute));
            colorProvider.RangeStops.Add(new HeatmapRangeStop(40, HeatmapRangeStopType.Absolute));
            colorProvider.RangeStops.Add(new HeatmapRangeStop(60, HeatmapRangeStopType.Absolute));
            colorProvider.RangeStops.Add(new HeatmapRangeStop(90, HeatmapRangeStopType.Absolute));
            colorProvider.RangeStops.Add(new HeatmapRangeStop(1, HeatmapRangeStopType.Percentage));

            heatmap.ColorProvider = colorProvider;

            heatmap.Titles.Add(new HeatmapTitle { Text = "Sales by Categories" });

            heatmap.Label.Visible = true;
            heatmap.Label.Pattern = "{V}";
        }
    }
}
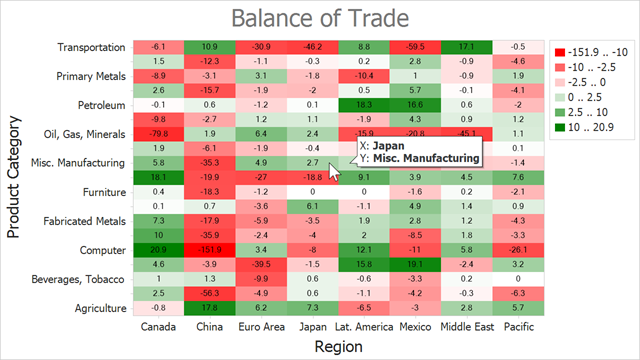
How to Bind a Heatmap to a Data Source (XML File)
The following example shows how to create a heatmap and bind it to a data source. In this example, the heatmap obtains data from an XML file.
- Add the
HeatmapControlto the Form. - Create a HeatmapDataSourceAdapter object and assign it to the HeatmapControl.DataAdapter property.
- Define the adapter’s DataSource property.
- Use the ColorDataMember property to define a data member that is used to determine cell colors.
Specify the following adapter properties to define data members that store heatmap arguments:
Create a HeatmapRangeColorProvider object and assign it to the heatmap’s ColorProvider property. The HeatmapRangeColorProvider paints cells based on a value range to which the cell value belongs.
- Add a HeatmapTitle to the heatmap’s Titles collection. Specify the title’s Text property.
- Use the heatmap’s Label property to configure cell label options. This example shows how to configure label text format.
- Set the HeatmapControl.ToolTipEnabled property to true to enable tooltips. Specify the HeatmapControl.ToolTipTextPattern property to define tooltip text display format.
using DevExpress.XtraCharts;
using DevExpress.XtraCharts.Heatmap;
using System.Data;
using System.Drawing;
using DevExpress.Drawing;
using System.IO;
using System.Windows.Forms;

namespace BindHeatmapToDataSource {
    public partial class Form1 : Form {
        public Form1() {
            InitializeComponent();
            DataTable data = CreateDataSet("BalanceOfTrade.xml");

            heatmap.DataAdapter = new HeatmapDataSourceAdapter() {
                XArgumentDataMember = "Country",
                YArgumentDataMember = "Product",
                ColorDataMember = "Value",
                DataSource = data
            };

            Palette palette = new Palette("Custom") { Color.Red, Color.White, Color.Green };

            HeatmapRangeColorProvider colorProvider = new HeatmapRangeColorProvider() {
                Palette = palette,
                ApproximateColors = true,
                LegendItemPattern = "{V1} .. {V2}"
            };

            heatmap.ColorProvider = colorProvider;

            colorProvider.RangeStops.Add(new HeatmapRangeStop(0, HeatmapRangeStopType.Percentage));
            colorProvider.RangeStops.Add(new HeatmapRangeStop(-10));
            colorProvider.RangeStops.Add(new HeatmapRangeStop(-2.5));
            colorProvider.RangeStops.Add(new HeatmapRangeStop(0));
            colorProvider.RangeStops.Add(new HeatmapRangeStop(2.5));
            colorProvider.RangeStops.Add(new HeatmapRangeStop(10));
            colorProvider.RangeStops.Add(new HeatmapRangeStop(1, HeatmapRangeStopType.Percentage));


            heatmap.Titles.Add(new HeatmapTitle { Text = "Balance of Trade" });

            heatmap.Legend.Visibility = DevExpress.Utils.DefaultBoolean.True;

            heatmap.Label.Visible = true;
            heatmap.Label.DXFont = new DXFont("SegoeUI", 6);
            heatmap.Label.Pattern = "{V}";
            heatmap.Label.Color = Color.Black;

            heatmap.ToolTipEnabled = true;
            heatmap.ToolTipController = new DevExpress.Utils.ToolTipController {
                AllowHtmlText = true,
                ToolTipLocation = DevExpress.Utils.ToolTipLocation.RightTop,
                ShowBeak = true
            };
            heatmap.ToolTipTextPattern = "X: <b>{X}</b>\nY: <b>{Y}</b>";

            heatmap.EnableAxisXScrolling = true;
            heatmap.EnableAxisYScrolling = true;
            heatmap.EnableAxisXZooming = true;
            heatmap.EnableAxisYZooming = true;

            heatmap.AxisX.Title.Text = "Region";
            heatmap.AxisX.Title.Visibility = DevExpress.Utils.DefaultBoolean.True;
            heatmap.AxisX.Label.Staggered = false;
            heatmap.AxisX.Label.ResolveOverlappingOptions.AllowStagger = false;
            heatmap.AxisX.Label.ResolveOverlappingOptions.AllowRotate = false;
            heatmap.AxisX.Label.ResolveOverlappingOptions.AllowHide = false;
            heatmap.AxisY.Title.Text = "Product Category";
            heatmap.AxisY.Title.Visibility = DevExpress.Utils.DefaultBoolean.True;
        }

        public static DataTable CreateDataSet(string xmlFileName) {
            string filePath = GetRelativePath(xmlFileName);
            if (!string.IsNullOrWhiteSpace(filePath)) {
                DataSet dataSet = new DataSet();
                dataSet.ReadXml(filePath);
                if (dataSet.Tables.Count > 0)
                    return dataSet.Tables[0];
            }
            return null;
        }
        public static string GetRelativePath(string name) {
            name = "Data\\" + name;
            DirectoryInfo dir = new DirectoryInfo(Application.StartupPath);
            for (int i = 0; i <= 10; i++) {
                string filePath = Path.Combine(dir.FullName, name);
                if (File.Exists(filePath))
                    return filePath;
                dir = Directory.GetParent(dir.FullName);
            }
            return string.Empty;
        }
    }
}
The XML file structure looks as follows:
<?xml version="1.0" standalone="yes"?>
<BalanceOfTrade xmlns:xsi="http://www.w3.org/2001/XMLSchema-instance" xmlns:xsd="http://www.w3.org/2001/XMLSchema">
  <xs:schema xmlns:xs="http://www.w3.org/2001/XMLSchema">
    <xs:element name="Item">
      <xs:complexType>
        <xs:sequence>
          <xs:element name="Country" type="xs:string"/>
          <xs:element name="Product" type="xs:string"/>
          <xs:element name="Value" type="xs:double"/>
        </xs:sequence>
      </xs:complexType>
    </xs:element>
  </xs:schema>
  <Item>
    <Country>China</Country>
    <Product>Computer</Product>
    <Value>-151.9</Value>
  </Item>
  <Item>
    <Country>China</Country>
    <Product>Oil, Gas, Minerals</Product>
    <Value>1.9</Value>
  </Item>
  <Item>
    <Country>China</Country>
    <Product>Transportation</Product>
    <Value>10.9</Value>
  </Item>
  <Item>
    <Country>China</Country>
    <Product>Apparel</Product>
    <Value>-56.3</Value>
  </Item>
  <!--...-->
</BalanceOfTrade>