HeatmapControl.DataAdapter Property
Gets or sets an adapter that is used to load data to the heatmap.
Namespace: DevExpress.XtraCharts.Heatmap
Assembly: DevExpress.XtraCharts.v26.1.UI.dll
Declaration
Property Value
| Type | Description |
|---|---|
| HeatmapDataAdapterBase | A HeatmapDataAdapterBase descendant. |
Remarks
The Heatmap Control uses data adapters to load data. Heatmap data adapters are derived from the HeatmapDataAdapterBase class. Use the Heatmap Control’s DataAdapter property to assign an adapter to a heatmap. The following adapters are available:
- HeatmapDataSourceAdapter – Allows you to bind the Heatmap Control to a data source.
- HeatmapMatrixAdapter – Allows you to use collections of values to specify x-arguments and y-arguments, and pass a matrix of numeric values to define heatmap cell values.
Examples
How to Bind a Heatmap to a Data Source (XML File)
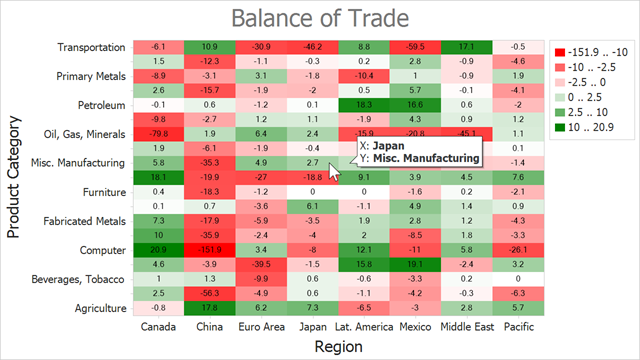
The following example shows how to create a heatmap and bind it to a data source. In this example, the heatmap obtains data from an XML file.
- Add the HeatmapControl to the Form.
- Create a HeatmapDataSourceAdapter object and assign it to the
HeatmapControl.DataAdapterproperty. - Define the adapter’s DataSource property.
- Use the ColorDataMember property to define a data member that is used to determine cell colors.
Specify the following adapter properties to define data members that store heatmap arguments:
Create a HeatmapRangeColorProvider object and assign it to the heatmap’s ColorProvider property. The HeatmapRangeColorProvider paints cells based on a value range to which the cell value belongs.
- Add a HeatmapTitle to the heatmap’s Titles collection. Specify the title’s Text property.
- Use the heatmap’s Label property to configure cell label options. This example shows how to configure label text format.
- Set the HeatmapControl.ToolTipEnabled property to true to enable tooltips. Specify the HeatmapControl.ToolTipTextPattern property to define tooltip text display format.
using DevExpress.XtraCharts;
using DevExpress.XtraCharts.Heatmap;
using System.Data;
using System.Drawing;
using DevExpress.Drawing;
using System.IO;
using System.Windows.Forms;

namespace BindHeatmapToDataSource {
    public partial class Form1 : Form {
        public Form1() {
            InitializeComponent();
            DataTable data = CreateDataSet("BalanceOfTrade.xml");

            heatmap.DataAdapter = new HeatmapDataSourceAdapter() {
                XArgumentDataMember = "Country",
                YArgumentDataMember = "Product",
                ColorDataMember = "Value",
                DataSource = data
            };

            Palette palette = new Palette("Custom") { Color.Red, Color.White, Color.Green };

            HeatmapRangeColorProvider colorProvider = new HeatmapRangeColorProvider() {
                Palette = palette,
                ApproximateColors = true,
                LegendItemPattern = "{V1} .. {V2}"
            };

            heatmap.ColorProvider = colorProvider;

            colorProvider.RangeStops.Add(new HeatmapRangeStop(0, HeatmapRangeStopType.Percentage));
            colorProvider.RangeStops.Add(new HeatmapRangeStop(-10));
            colorProvider.RangeStops.Add(new HeatmapRangeStop(-2.5));
            colorProvider.RangeStops.Add(new HeatmapRangeStop(0));
            colorProvider.RangeStops.Add(new HeatmapRangeStop(2.5));
            colorProvider.RangeStops.Add(new HeatmapRangeStop(10));
            colorProvider.RangeStops.Add(new HeatmapRangeStop(1, HeatmapRangeStopType.Percentage));


            heatmap.Titles.Add(new HeatmapTitle { Text = "Balance of Trade" });

            heatmap.Legend.Visibility = DevExpress.Utils.DefaultBoolean.True;

            heatmap.Label.Visible = true;
            heatmap.Label.DXFont = new DXFont("SegoeUI", 6);
            heatmap.Label.Pattern = "{V}";
            heatmap.Label.Color = Color.Black;

            heatmap.ToolTipEnabled = true;
            heatmap.ToolTipController = new DevExpress.Utils.ToolTipController {
                AllowHtmlText = true,
                ToolTipLocation = DevExpress.Utils.ToolTipLocation.RightTop,
                ShowBeak = true
            };
            heatmap.ToolTipTextPattern = "X: <b>{X}</b>\nY: <b>{Y}</b>";

            heatmap.EnableAxisXScrolling = true;
            heatmap.EnableAxisYScrolling = true;
            heatmap.EnableAxisXZooming = true;
            heatmap.EnableAxisYZooming = true;

            heatmap.AxisX.Title.Text = "Region";
            heatmap.AxisX.Title.Visibility = DevExpress.Utils.DefaultBoolean.True;
            heatmap.AxisX.Label.Staggered = false;
            heatmap.AxisX.Label.ResolveOverlappingOptions.AllowStagger = false;
            heatmap.AxisX.Label.ResolveOverlappingOptions.AllowRotate = false;
            heatmap.AxisX.Label.ResolveOverlappingOptions.AllowHide = false;
            heatmap.AxisY.Title.Text = "Product Category";
            heatmap.AxisY.Title.Visibility = DevExpress.Utils.DefaultBoolean.True;
        }

        public static DataTable CreateDataSet(string xmlFileName) {
            string filePath = GetRelativePath(xmlFileName);
            if (!string.IsNullOrWhiteSpace(filePath)) {
                DataSet dataSet = new DataSet();
                dataSet.ReadXml(filePath);
                if (dataSet.Tables.Count > 0)
                    return dataSet.Tables[0];
            }
            return null;
        }
        public static string GetRelativePath(string name) {
            name = "Data\\" + name;
            DirectoryInfo dir = new DirectoryInfo(Application.StartupPath);
            for (int i = 0; i <= 10; i++) {
                string filePath = Path.Combine(dir.FullName, name);
                if (File.Exists(filePath))
                    return filePath;
                dir = Directory.GetParent(dir.FullName);
            }
            return string.Empty;
        }
    }
}
The XML file structure looks as follows:
<?xml version="1.0" standalone="yes"?>
<BalanceOfTrade xmlns:xsi="http://www.w3.org/2001/XMLSchema-instance" xmlns:xsd="http://www.w3.org/2001/XMLSchema">
  <xs:schema xmlns:xs="http://www.w3.org/2001/XMLSchema">
    <xs:element name="Item">
      <xs:complexType>
        <xs:sequence>
          <xs:element name="Country" type="xs:string"/>
          <xs:element name="Product" type="xs:string"/>
          <xs:element name="Value" type="xs:double"/>
        </xs:sequence>
      </xs:complexType>
    </xs:element>
  </xs:schema>
  <Item>
    <Country>China</Country>
    <Product>Computer</Product>
    <Value>-151.9</Value>
  </Item>
  <Item>
    <Country>China</Country>
    <Product>Oil, Gas, Minerals</Product>
    <Value>1.9</Value>
  </Item>
  <Item>
    <Country>China</Country>
    <Product>Transportation</Product>
    <Value>10.9</Value>
  </Item>
  <Item>
    <Country>China</Country>
    <Product>Apparel</Product>
    <Value>-56.3</Value>
  </Item>
  <!--...-->
</BalanceOfTrade>
How to Create a Heatmap Based on a Matrix of Numeric Values
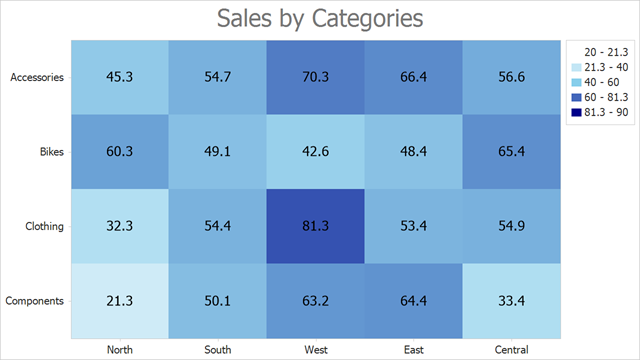
This example shows how to use arrays of string and numeric values to create a heatmap.
Follow the steps below to create a heatmap:
- Add the HeatmapControl to the Form.
- Create a HeatmapMatrixAdapter object and assign it to the
HeatmapControl.DataAdapterproperty. - Use the adapter’s XArguments and YArguments properties to populate the heatmap with x- and y-arguments that are displayed along x- and y-axes.
- Assign a two-dimensional array of double values to the adapter’s Values property.
- Create a HeatmapRangeColorProvider object and assign it to the heatmap’s ColorProvider property. The HeatmapRangeColorProvider paints cells based on a value range to which the cell value belongs.
- Add a HeatmapTitle to the heatmap’s Titles collection. Specify the title’s Text property.
- Use the heatmap’s Label property to configure cell label options. This example shows how to configure label text format.
using DevExpress.XtraCharts;
using DevExpress.XtraCharts.Heatmap;
using System.Drawing;
using System.Windows.Forms;

namespace HeatmapMatrixData {
    public partial class Form1 : Form {
        public Form1() {
            InitializeComponent();

            HeatmapMatrixAdapter dataAdapter = new HeatmapMatrixAdapter();
            dataAdapter.XArguments = new string[] { "North", "South", "West", "East", "Central" };
            dataAdapter.YArguments = new string[] { "Components", "Clothing", "Bikes", "Accessories" };
            dataAdapter.Values = new double[,] {
                { 21.3, 50.1, 63.2, 64.4, 33.4 },
                { 32.3, 54.4, 81.3, 53.4, 54.9 },
                { 60.3, 49.1, 42.6, 48.4, 65.4 },
                { 45.3, 54.7, 70.3, 66.4, 56.6 }
            };
            heatmap.DataAdapter = dataAdapter;

            Palette palette = new Palette("Custom") {
                Color.White,
                Color.SkyBlue,
                Color.DarkBlue
            };

            HeatmapRangeColorProvider colorProvider = new HeatmapRangeColorProvider() {
                Palette = palette,
                ApproximateColors = true
            };
            colorProvider.RangeStops.Add(new HeatmapRangeStop(0, HeatmapRangeStopType.Percentage));
            colorProvider.RangeStops.Add(new HeatmapRangeStop(20, HeatmapRangeStopType.Absolute));
            colorProvider.RangeStops.Add(new HeatmapRangeStop(40, HeatmapRangeStopType.Absolute));
            colorProvider.RangeStops.Add(new HeatmapRangeStop(60, HeatmapRangeStopType.Absolute));
            colorProvider.RangeStops.Add(new HeatmapRangeStop(90, HeatmapRangeStopType.Absolute));
            colorProvider.RangeStops.Add(new HeatmapRangeStop(1, HeatmapRangeStopType.Percentage));

            heatmap.ColorProvider = colorProvider;

            heatmap.Titles.Add(new HeatmapTitle { Text = "Sales by Categories" });

            heatmap.Label.Visible = true;
            heatmap.Label.Pattern = "{V}";
        }
    }
}
Related GitHub Examples
The following code snippets (auto-collected from DevExpress Examples) contain references to the DataAdapter property.
Note
The algorithm used to collect these code examples remains a work in progress. Accordingly, the links and snippets below may produce inaccurate results. If you encounter an issue with code examples below, please use the feedback form on this page to report the issue.