HeatmapControl.Titles Property
Returns the collection of heatmap titles.
Namespace: DevExpress.XtraCharts.Heatmap
Assembly: DevExpress.XtraCharts.v24.2.UI.dll
NuGet Package: DevExpress.Win.Charts
#Declaration
public HeatmapTitleCollection Titles { get; }#Property Value
| Type | Description |
|---|---|
| Heatmap |
The collection of heatmap titles. |
#Remarks
Add a HeatmapTitle object to the Titles collection and specify the title Text property to add a title for the Heatmap Control.
#Example
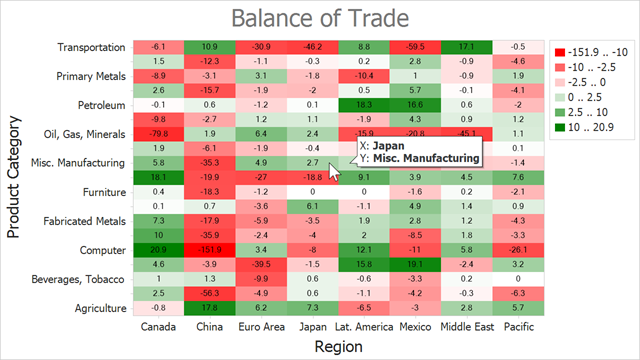
The following example shows how to create a heatmap and bind it to a data source. In this example, the heatmap obtains data from an XML file.

- Add the HeatmapControl to the Form.
- Create a HeatmapDataSourceAdapter object and assign it to the HeatmapControl.DataAdapter property.
- Define the adapter’s DataSource property.
- Use the ColorDataMember property to define a data member that is used to determine cell colors.
Specify the following adapter properties to define data members that store heatmap arguments:
Create a HeatmapRangeColorProvider object and assign it to the heatmap’s ColorProvider property. The HeatmapRangeColorProvider paints cells based on a value range to which the cell value belongs.
- Add a HeatmapTitle to the heatmap’s
Titlescollection. Specify the title’s Text property. - Use the heatmap’s Label property to configure cell label options. This example shows how to configure label text format.
- Set the HeatmapControl.ToolTipEnabled property to true to enable tooltips. Specify the HeatmapControl.ToolTipTextPattern property to define tooltip text display format.
using DevExpress.XtraCharts;
using DevExpress.XtraCharts.Heatmap;
using System.Data;
using System.Drawing;
using DevExpress.Drawing;
using System.IO;
using System.Windows.Forms;

namespace BindHeatmapToDataSource {
    public partial class Form1 : Form {
        public Form1() {
            InitializeComponent();
            DataTable data = CreateDataSet("BalanceOfTrade.xml");

            heatmap.DataAdapter = new HeatmapDataSourceAdapter() {
                XArgumentDataMember = "Country",
                YArgumentDataMember = "Product",
                ColorDataMember = "Value",
                DataSource = data
            };

            Palette palette = new Palette("Custom") { Color.Red, Color.White, Color.Green };

            HeatmapRangeColorProvider colorProvider = new HeatmapRangeColorProvider() {
                Palette = palette,
                ApproximateColors = true,
                LegendItemPattern = "{V1} .. {V2}"
            };

            heatmap.ColorProvider = colorProvider;

            colorProvider.RangeStops.Add(new HeatmapRangeStop(0, HeatmapRangeStopType.Percentage));
            colorProvider.RangeStops.Add(new HeatmapRangeStop(-10));
            colorProvider.RangeStops.Add(new HeatmapRangeStop(-2.5));
            colorProvider.RangeStops.Add(new HeatmapRangeStop(0));
            colorProvider.RangeStops.Add(new HeatmapRangeStop(2.5));
            colorProvider.RangeStops.Add(new HeatmapRangeStop(10));
            colorProvider.RangeStops.Add(new HeatmapRangeStop(1, HeatmapRangeStopType.Percentage));


            heatmap.Titles.Add(new HeatmapTitle { Text = "Balance of Trade" });

            heatmap.Legend.Visibility = DevExpress.Utils.DefaultBoolean.True;

            heatmap.Label.Visible = true;
            heatmap.Label.DXFont = new DXFont("SegoeUI", 6);
            heatmap.Label.Pattern = "{V}";
            heatmap.Label.Color = Color.Black;

            heatmap.ToolTipEnabled = true;
            heatmap.ToolTipController = new DevExpress.Utils.ToolTipController {
                AllowHtmlText = true,
                ToolTipLocation = DevExpress.Utils.ToolTipLocation.RightTop,
                ShowBeak = true
            };
            heatmap.ToolTipTextPattern = "X: <b>{X}</b>\nY: <b>{Y}</b>";

            heatmap.EnableAxisXScrolling = true;
            heatmap.EnableAxisYScrolling = true;
            heatmap.EnableAxisXZooming = true;
            heatmap.EnableAxisYZooming = true;

            heatmap.AxisX.Title.Text = "Region";
            heatmap.AxisX.Title.Visibility = DevExpress.Utils.DefaultBoolean.True;
            heatmap.AxisX.Label.Staggered = false;
            heatmap.AxisX.Label.ResolveOverlappingOptions.AllowStagger = false;
            heatmap.AxisX.Label.ResolveOverlappingOptions.AllowRotate = false;
            heatmap.AxisX.Label.ResolveOverlappingOptions.AllowHide = false;
            heatmap.AxisY.Title.Text = "Product Category";
            heatmap.AxisY.Title.Visibility = DevExpress.Utils.DefaultBoolean.True;
        }

        public static DataTable CreateDataSet(string xmlFileName) {
            string filePath = GetRelativePath(xmlFileName);
            if (!string.IsNullOrWhiteSpace(filePath)) {
                DataSet dataSet = new DataSet();
                dataSet.ReadXml(filePath);
                if (dataSet.Tables.Count > 0)
                    return dataSet.Tables[0];
            }
            return null;
        }
        public static string GetRelativePath(string name) {
            name = "Data\\" + name;
            DirectoryInfo dir = new DirectoryInfo(Application.StartupPath);
            for (int i = 0; i <= 10; i++) {
                string filePath = Path.Combine(dir.FullName, name);
                if (File.Exists(filePath))
                    return filePath;
                dir = Directory.GetParent(dir.FullName);
            }
            return string.Empty;
        }
    }
}
The XML file structure looks as follows:
<?xml version="1.0" standalone="yes"?>
<BalanceOfTrade xmlns:xsi="http://www.w3.org/2001/XMLSchema-instance" xmlns:xsd="http://www.w3.org/2001/XMLSchema">
  <xs:schema xmlns:xs="http://www.w3.org/2001/XMLSchema">
    <xs:element name="Item">
      <xs:complexType>
        <xs:sequence>
          <xs:element name="Country" type="xs:string"/>
          <xs:element name="Product" type="xs:string"/>
          <xs:element name="Value" type="xs:double"/>
        </xs:sequence>
      </xs:complexType>
    </xs:element>
  </xs:schema>
  <Item>
    <Country>China</Country>
    <Product>Computer</Product>
    <Value>-151.9</Value>
  </Item>
  <Item>
    <Country>China</Country>
    <Product>Oil, Gas, Minerals</Product>
    <Value>1.9</Value>
  </Item>
  <Item>
    <Country>China</Country>
    <Product>Transportation</Product>
    <Value>10.9</Value>
  </Item>
  <Item>
    <Country>China</Country>
    <Product>Apparel</Product>
    <Value>-56.3</Value>
  </Item>
  <!--...-->
</BalanceOfTrade>