Charts in Rich Text Documents
- 14 minutes to read
The WinForms Rich Text Editor allows you to load, view, save, print, and export documents with charts to PDF. You can use the Spreadsheet Chart API to create 2-D and 3-D charts in code, apply chart styles, and format individual chart elements.
Enable Charts in the Rich Text Editor
The Rich Text Editor uses WinForms Spreadsheet Charts to render, import, and export documents that contain charts. Follow the steps below to enable spreadsheet charts in the Rich Text Editor:
Add references to the following assemblies:
- DevExpress.Spreadsheet.v26.1.Core.dll
- DevExpress.XtraSpreadsheet.v26.1.dll
- DevExpress.Charts.v26.1.Core.dll
- DevExpress.XtraCharts.v26.1.dll
- DevExpress.DataVisualization.v26.1.Core.dll
- DevExpress.TreeMap.v26.1.Core.dll
- DevExpress.XtraTreeMap.v26.1.dll
Call the following method before the control is initialized:
Create Charts
Charts are stored in the SubDocument.Shapes collection. Use the ShapeCollection.InsertChart method to add a chart to a document. Pass a ChartType enumeration member to this method to specify the chart type.
Use the following properties to populate the chart with data:
- Shape.ChartFormat.Chart
- Cast this property value to DevExpress.Spreadsheet.Charts.ChartObject to obtain a spreadsheet chart associated with the inserted chart object. Use the Spreadsheet Chart API to specify chart settings (select the source data, define series options, and specify the chart layout).
- Shape.ChartFormat.Worksheet
- Cast this property value to a DevExpress.Spreadsheet.Worksheet object to obtain a worksheet that stores chart data.
Create a Simple Chart
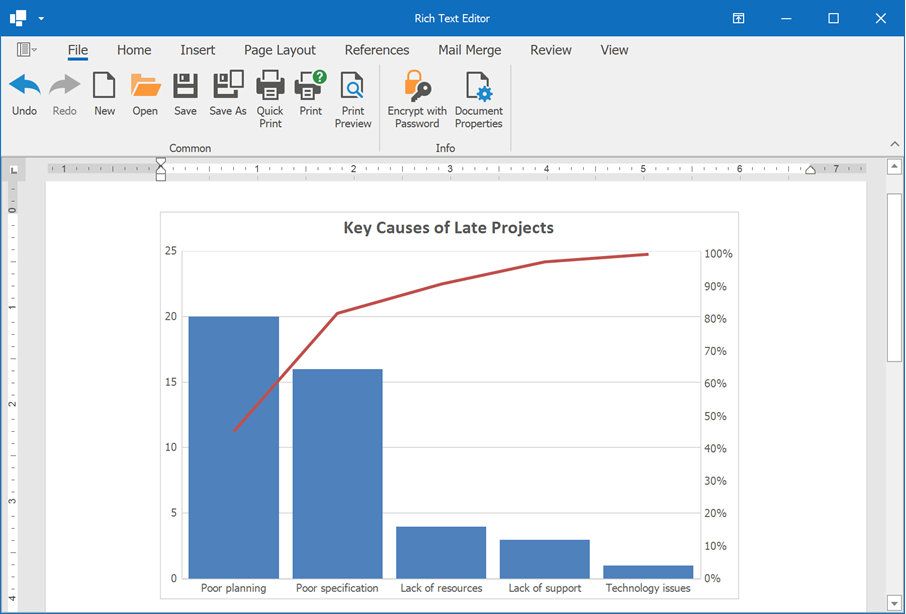
The following code snippet adds a Pareto chart to a document:
using DevExpress.Office.Services;
using DevExpress.XtraSpreadsheet.Services;
using DevExpress.XtraRichEdit.API.Native;
using DevExpress.Spreadsheet.Charts;
using DevExpress.Spreadsheet;
using System.Drawing;
// ...

Document document = richEditControl1.Document;
// Set measurement unit to inches.
document.Unit = DevExpress.Office.DocumentUnit.Inch;
// Create a Pareto chart.
var chartShape = document.Shapes.InsertChart(document.Range.Start,
    DevExpress.XtraRichEdit.API.Native.ChartType.Pareto);
chartShape.Name = "Pareto chart";
// Specify the chart size and position.
chartShape.Size = new System.Drawing.SizeF(6, 4);
chartShape.RelativeHorizontalPosition = ShapeRelativeHorizontalPosition.Column;
chartShape.RelativeVerticalPosition = ShapeRelativeVerticalPosition.Paragraph;
chartShape.Offset = new PointF(0, 0);

// Access the spreadsheet chart object.
ChartObject chart = (ChartObject)chartShape.ChartFormat.Chart;
// Access a worksheet that stores chart data.
Worksheet worksheet = (Worksheet)chartShape.ChartFormat.Worksheet;
// Populate the worksheet with data.
SpecifyChartData(worksheet);
// Select chart data.
chart.SelectData(worksheet["B2:C7"]);

// Specify series options.
var options = chart.Series[0].LayoutOptions.Histogram;
options.BinType = HistogramBinType.ByCategory;
// Specify the gap width.
chart.Series[0].GapWidth = 15;

// Add the chart title.
chart.Title.Visible = true;
chart.Title.SetValue("Key Causes of Late Projects");

private static void SpecifyChartData(Worksheet sheet)
{
    // The first column.
    sheet["B2"].Value = "Key causes of late projects";
    sheet["B3"].Value = "Poor specification";
    sheet["B4"].Value = "Poor planning";
    sheet["B5"].Value = "Lack of support";
    sheet["B6"].Value = "Lack of resources";
    sheet["B7"].Value = "Technology issues";
    // The second column.
    sheet["C2"].Value = "Frequency of occurrences";
    sheet["C3"].Value = 16;
    sheet["C4"].Value = 20;
    sheet["C5"].Value = 3;
    sheet["C6"].Value = 4;
    sheet["C7"].Value = 1;
}
Create a Combination Chart
The Spreadsheet Chart API allows you to create a combination chart that includes data series of different chart types. Use the Series.ChangeType method to change the series type.
Important
There are chart types that cannot be combined (for example, you cannot display 2-D and 3-D series on a chart). Refer to the following topic for a list of compatible chart types: How to: Create and Modify a Chart.
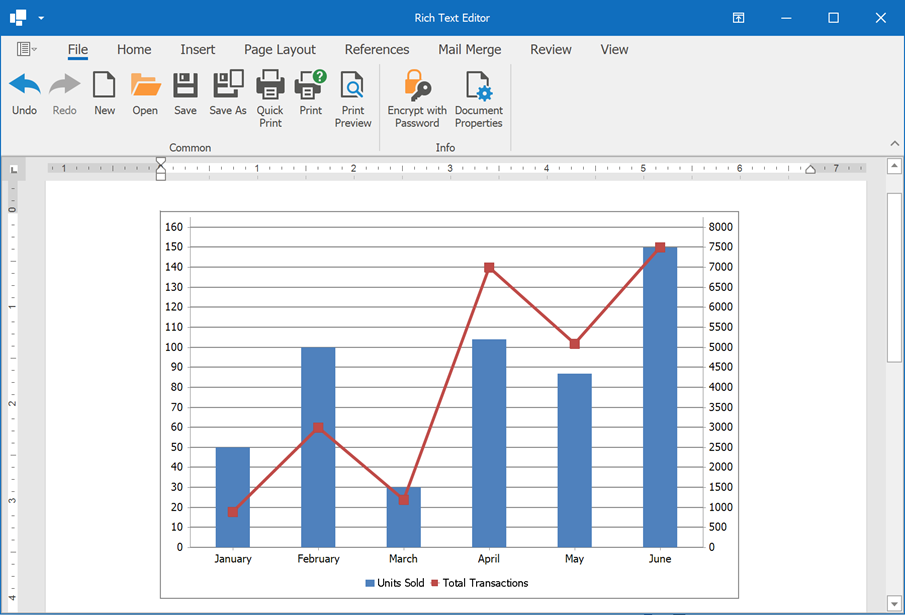
The following code snippet creates a chart that combines a column and a line data series:
using DevExpress.Office.Services;
using DevExpress.XtraSpreadsheet.Services;
using DevExpress.XtraRichEdit.API.Native;
using DevExpress.Spreadsheet.Charts;
using DevExpress.Spreadsheet;
using System.Drawing;
// ...

Document document = richEditControl1.Document;
// Set measurement unit to inches.
document.Unit = DevExpress.Office.DocumentUnit.Inch;
// Create a clustered column chart.
var chartShape = document.Shapes.InsertChart(document.Range.Start,
    DevExpress.XtraRichEdit.API.Native.ChartType.ColumnClustered);
chartShape.Name = "Combo chart";
// Specify the chart size and position.
chartShape.Size = new System.Drawing.SizeF(6, 4);
chartShape.RelativeHorizontalPosition = ShapeRelativeHorizontalPosition.Column;
chartShape.RelativeVerticalPosition = ShapeRelativeVerticalPosition.Paragraph;
chartShape.Offset = new PointF(0, 0);

// Access the spreadsheet chart object.
ChartObject chart = (ChartObject)chartShape.ChartFormat.Chart;
// Access a worksheet that stores chart data.
Worksheet worksheet = (Worksheet)chartShape.ChartFormat.Worksheet;
// Populate the worksheet with data.
SpecifyChartData(worksheet);
// Select chart data.
chart.SelectData(worksheet["B2:D8"]);

// Change the second series type.
chart.Series[1].ChangeType(DevExpress.Spreadsheet.Charts.ChartType.LineMarker);

// Display the secondary axis.
chart.Series[1].AxisGroup = AxisGroup.Secondary;

// Position the chart legend.
chart.Legend.Position = LegendPosition.Bottom;

private static void SpecifyChartData(Worksheet sheet)
{
    // The first column.
    sheet["B2"].Value = "Month";
    sheet["B3"].Value = "January";
    sheet["B4"].Value = "February";
    sheet["B5"].Value = "March";
    sheet["B6"].Value = "April";
    sheet["B7"].Value = "May";
    sheet["B8"].Value = "June";
    // The second column.
    sheet["C2"].Value = "Units Sold";
    sheet["C3"].Value = 50;
    sheet["C4"].Value = 100;
    sheet["C5"].Value = 30;
    sheet["C6"].Value = 104;
    sheet["C7"].Value = 87;
    sheet["C8"].Value = 150;
    // The third column.
    sheet["D2"].Value = "Total Transactions";
    sheet["D3"].Value = 900;
    sheet["D4"].Value = 3000;
    sheet["D5"].Value = 1200;
    sheet["D6"].Value = 7000;
    sheet["D7"].Value = 5100;
    sheet["D8"].Value = 7500;
}
Access Charts
Use the ShapeCollection.Item property to return a chart from a shape collection. The Shape.Type property helps you distinguish between different drawing object types in the document.
The following code snippets returns all clustered column charts from the document. The ChartObject.ChartType property is used to find charts of the required type.
using DevExpress.Office.Services;
using DevExpress.XtraSpreadsheet.Services;
using DevExpress.XtraRichEdit.API.Native;
using DevExpress.Spreadsheet.Charts;
using System.Collections.Generic;
using System.Linq;
// ...

Document document = richEditControl1.Document;
List<DevExpress.XtraRichEdit.API.Native.Shape> columnCharts = document.Shapes
    .Where(x => x.Type == DevExpress.XtraRichEdit.API.Native.ShapeType.Chart &&
    ((ChartObject)x.ChartFormat.Chart).ChartType == DevExpress.Spreadsheet.Charts.ChartType.ColumnClustered)
    .ToList();
Change the Chart Layout
The Spreadsheet Chart API allows you to add or remove different chart elements:
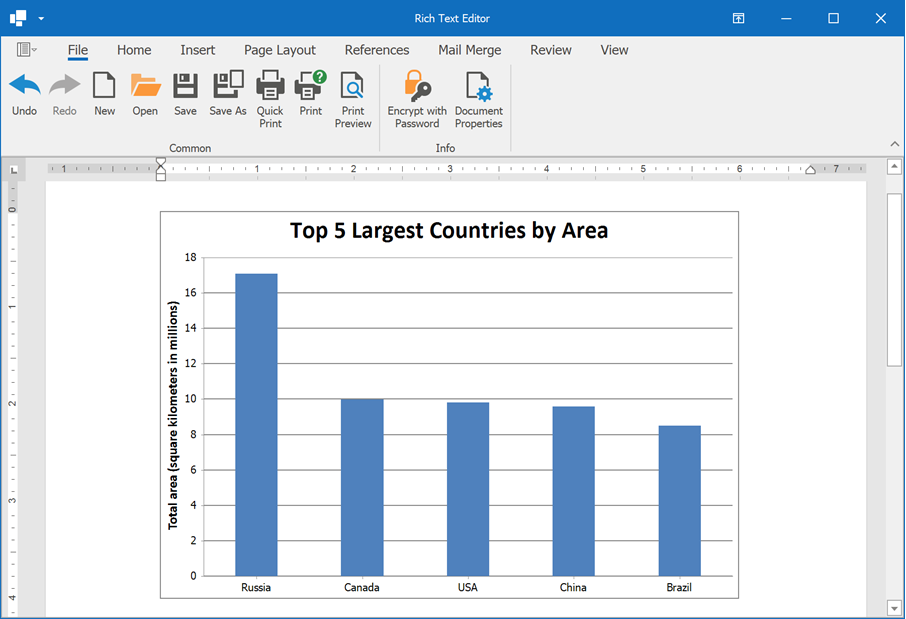
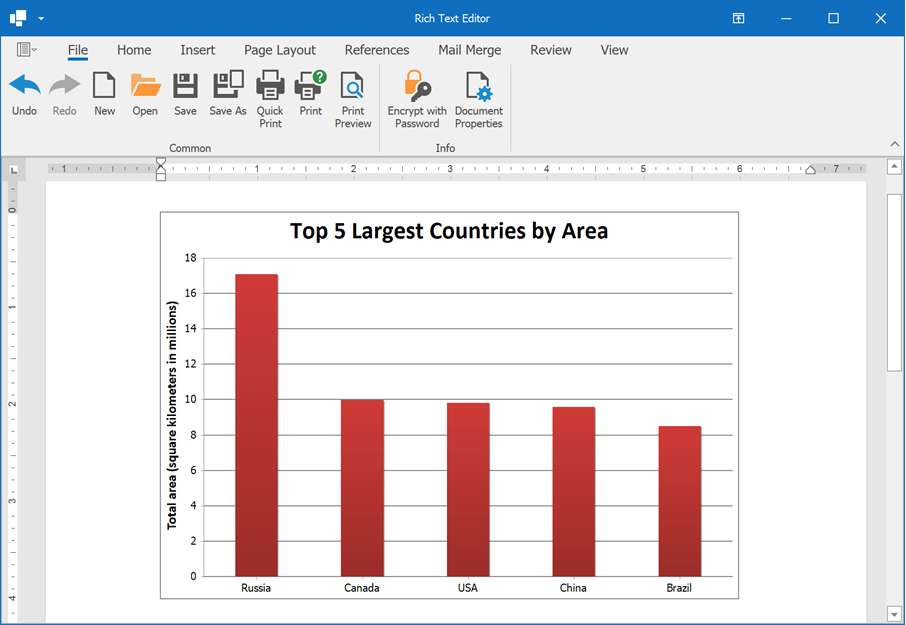
The following example demonstrates how to create a clustered column chart and specify its layout:
using DevExpress.Office.Services;
using DevExpress.XtraSpreadsheet.Services;
using DevExpress.XtraRichEdit.API.Native;
using DevExpress.Spreadsheet.Charts;
using DevExpress.Spreadsheet;
using System.Drawing;
// ...

Document document = richEditControl1.Document;
// Set measurement unit to inches.
document.Unit = DevExpress.Office.DocumentUnit.Inch;
// Create a clustered column chart.
var chartShape = document.Shapes.InsertChart(document.Range.Start,
    DevExpress.XtraRichEdit.API.Native.ChartType.ColumnClustered);
chartShape.Name = "Largest countries chart";
// Specify the chart size and position.
chartShape.Size = new System.Drawing.SizeF(6, 4);
chartShape.RelativeHorizontalPosition = ShapeRelativeHorizontalPosition.Column;
chartShape.RelativeVerticalPosition = ShapeRelativeVerticalPosition.Paragraph;
chartShape.Offset = new PointF(0, 0);

// Access the spreadsheet chart object.
ChartObject chart = (ChartObject)chartShape.ChartFormat.Chart;
// Access a worksheet that stores chart data.
Worksheet worksheet = (Worksheet)chartShape.ChartFormat.Worksheet;
// Populate the worksheet with data.
SpecifyChartData(worksheet);
// Select chart data.
chart.SelectData(worksheet["B2:C7"]);

// Display the chart title.
chart.Title.Visible = true;
chart.Title.SetValue("Top 5 Largest Countries by Area");

// Access the value axis.
Axis valueAxis = chart.PrimaryAxes[1];
// Set minimum and maximum scale values.
valueAxis.Scaling.AutoMax = false;
valueAxis.Scaling.Max = 18000000;
valueAxis.Scaling.AutoMin = false;
valueAxis.Scaling.Min = 0;
// Specify the distance between major tick marks.
valueAxis.MajorUnit = 2000000;
// Specify display units for the value axis.
valueAxis.DisplayUnits.UnitType = DisplayUnitType.Millions;
valueAxis.DisplayUnits.ShowLabel = true;
// Specify the axis title.
valueAxis.Title.Visible = true;
valueAxis.Title.SetValue("Total area (square kilometers in millions)");
// Display major gridlines.
valueAxis.MajorGridlines.Visible = true;

// Hide the chart legend.
chart.Legend.Visible = false;

private static void SpecifyChartData(Worksheet sheet)
{
    // The first column.
    sheet["B2"].Value = "Country";
    sheet["B3"].Value = "Russia";
    sheet["B4"].Value = "Canada";
    sheet["B5"].Value = "USA";
    sheet["B6"].Value = "China";
    sheet["B7"].Value = "Brazil";
    // The second column.
    sheet["C2"].Value = "Total Area";
    sheet["C3"].Value = 17098246;
    sheet["C4"].Value = 9984670;
    sheet["C5"].Value = 9833517;
    sheet["C6"].Value = 9596961;
    sheet["C7"].Value = 8515767;
}
Change the Chart Type
Use the ChartObject.ChangeType method to change the type of an existing chart. If the operation cannot be completed, an exception occurs.
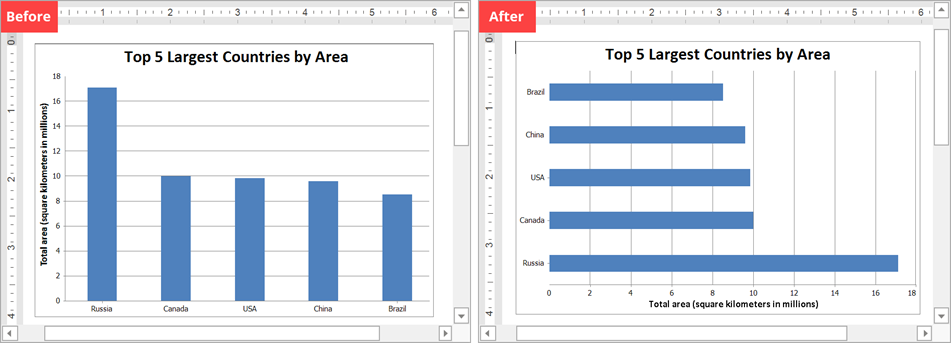
The following example converts a clustered column chart into a clustered bar chart:
using DevExpress.Office.Services;
using DevExpress.XtraSpreadsheet.Services;
using DevExpress.XtraRichEdit.API.Native;
using DevExpress.Spreadsheet.Charts;
// ...

Document document = richEditControl1.Document;
document.LoadDocument("Charts.docx");
// Return a chart with the specified name.
var chartShape = document.Shapes["Largest countries chart"];
if(chartShape != null)
{
    // Access the spreadsheet chart object.
    ChartObject chart = (ChartObject)chartShape.ChartFormat.Chart;

    // Change the chart type.
    chart.ChangeType(DevExpress.Spreadsheet.Charts.ChartType.BarClustered);
}
Format Chart Elements
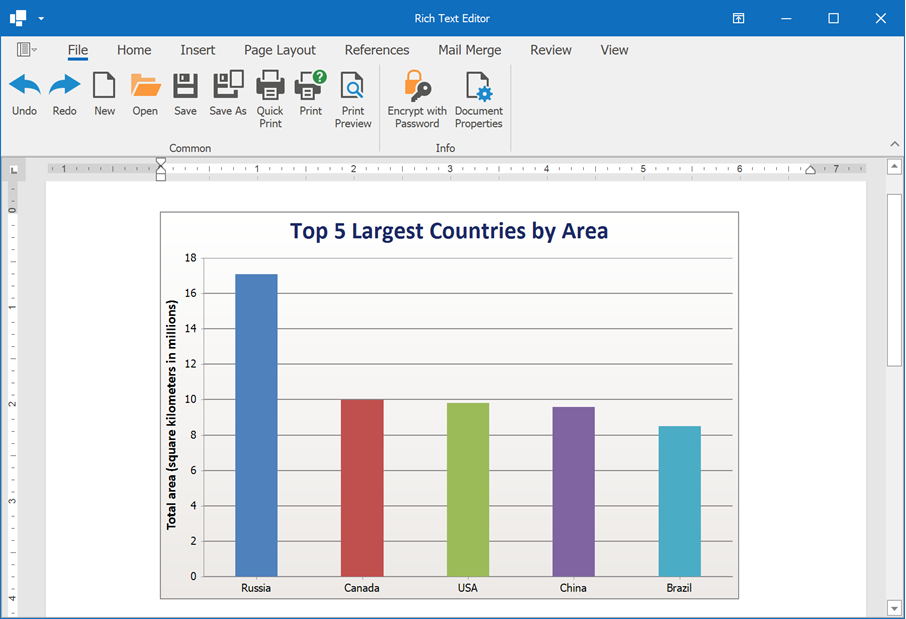
Apply a Chart Style
Use the ChartObject.Style property to apply one of the predefined styles to a chart. Each style specifies data series colors, sets the chart’s background fill, applies different shape effects and outlines to the chart.
The following example applies the Accent2Bevel style to a chart:
using DevExpress.Office.Services;
using DevExpress.XtraSpreadsheet.Services;
using DevExpress.XtraRichEdit.API.Native;
using DevExpress.Spreadsheet.Charts;
// ...

Document document = richEditControl1.Document;
document.LoadDocument("Charts.docx");
// Return a chart with the specified name.
var chartShape = document.Shapes["Largest countries chart"];
if(chartShape != null)
{
    // Access the spreadsheet chart object.
    ChartObject chart = (ChartObject)chartShape.ChartFormat.Chart;

    // Apply a chart style.
    chart.Style = ChartStyle.Accent2Bevel;
}
Format Individual Elements
Chart elements (ChartObject, Series, DataPoint, Axis, DataLabel, ChartTitle, and so on) are inherited from the ShapeFormatBase and ShapeTextFormat interfaces. These interfaces contain the following options to change the appearance of chart elements:
- ShapeFormatBase.Fill
- Defines fill options.
- ShapeFormatBase.Outline
- Returns format settings for line elements (axes, gridlines, line series, and so on) or a chart element’s border.
- ShapeTextFormat.Font
- Specifies font characteristics for text labels on the chart.
The following code snippet demonstrates how to change the appearance of individual chart elements:
using DevExpress.Office.Services;
using DevExpress.XtraSpreadsheet.Services;
using DevExpress.XtraRichEdit.API.Native;
using DevExpress.Spreadsheet.Charts;
using System.Drawing;
using DevExpress.Spreadsheet.Drawings;
// ...

Document document = richEditControl1.Document;
document.LoadDocument("Charts.docx");
// Return a chart with the specified name.
var chartShape = document.Shapes["Largest countries chart"];
if(chartShape != null)
{
    // Access the spreadsheet chart object.
    ChartObject chart = (ChartObject)chartShape.ChartFormat.Chart;

    //Specify that each data point has a different color.
    chart.Views[0].VaryColors = true;

    // Make the plot area transparent.
    chart.PlotArea.Fill.SetNoFill();

    // Apply a gradient fill to the chart area.
    chart.Fill.SetGradientFill(ShapeGradientType.Linear, Color.FromArgb(0xFF, 0xFF, 0xFF),
        Color.FromArgb(0xEC, 0xE9, 0xE6));
    chart.Fill.GradientFill.Angle = 90;

    // Change font color for the chart title.
    chart.Title.Font.Color = Color.FromArgb(0x1D, 0x2B, 0x64);
}
Remove Charts
Use one of the following methods to remove a chart from the document:
ShapeCollection.Remove – removes a specific chart from the collection.
ShapeCollection.RemoveAt – removes a chart with the specified index from the collection.
ShapeCollection.Clear – clears the shape collection.
The following example removes all charts from the collection:
Document document = richEditControl1.Document;
var shapes = document.Shapes;
for (int i = shapes.Count - 1; i >= 0; i--)
{
    if (shapes[i].Type == DevExpress.XtraRichEdit.API.Native.ShapeType.Chart)
    shapes.Remove(shapes[i]);
}
Limitations
The Rich Text Editor does not contain user interface elements to insert or modify charts.
The Rich Text Editor does not support charts in OpenDocument Text (.odt) documents and encrypted DOC files.