ChartObject.Style Property
Returns or specifies the chart style.
Namespace: DevExpress.Spreadsheet.Charts
Assembly: DevExpress.Spreadsheet.v24.2.Core.dll
NuGet Package: DevExpress.Spreadsheet.Core
#Declaration
ChartStyle Style { get; set; }#Property Value
| Type | Description |
|---|---|
| Chart |
An enumeration value that defines a style to apply to the chart. |
Available values:
| Name | Description |
|---|---|
| Gray | A monochromatic chart style that applies different shades of the Dark1 theme color to each data series. |
|
Gray |
A monochromatic chart style that applies different shades of the Dark1 theme color to each data series and specifies shape outlines. |
|
Gray |
A monochromatic chart style that applies different shades of the Dark1 theme color with a gradient effect to each data series. |
|
Gray |
A monochromatic chart style that applies different shades of the Dark1 theme color to each data series and specifies shape effects (such as beveled edges and shadows). |
|
Gray |
A monochromatic chart style that applies different shades of the Dark1 theme color to each data series and uses 20% tint of this color to fill the plot area. |
|
Gray |
A monochromatic chart style that applies different shades of the Dark1 theme color to each data series and uses this color to fill the chart area. |
| Color | A colorful chart style that applies one of six accent colors defined by the document’s theme to each data series. |
|
Color |
A colorful chart style that applies one of six accent colors to each data series and specifies shape outlines. |
|
Color |
A colorful chart style that applies one of six accent colors with a gradient effect to each data series. |
|
Color |
A colorful chart style that applies one of six accent colors to each data series and specifies shape effects (such as beveled edges and shadows). |
|
Color |
A colorful chart style that applies one of six accent colors to each data series and uses 20% tint of the Dark1 theme color to fill the plot area. |
|
Color |
A colorful chart style that applies one of six accent colors and shape effects to each data series, and uses the Dark1 theme color to fill the chart area. |
| Accent1 | A monochromatic chart style that applies different shades of the Accent1 theme color to each data series. |
| Accent1Outline | A monochromatic chart style that applies different shades of the Accent1 theme color to each data series and specifies shape outlines. |
| Accent1Gradient | A monochromatic chart style that applies different shades of the Accent1 theme color with a gradient effect to each data series. |
| Accent1Bevel | A monochromatic chart style that applies different shades of the Accent1 theme color to each data series and specifies shape effects (such as beveled edges and shadows). |
| Accent1Area | A monochromatic chart style that applies different shades of the Accent1 theme color to each data series and uses this color to fill the plot area. |
| Accent1Dark | A monochromatic chart style that applies different shades of the Accent1 theme color and shape effects to each data series. This style uses the Dark1 theme color to fill the chart area. |
| Accent2 | A monochromatic chart style that applies different shades of the Accent2 theme color to each data series. |
| Accent2Outline | A monochromatic chart style that applies different shades of the Accent2 theme color to each data series and specifies shape outlines. |
| Accent2Gradient | A monochromatic chart style that applies different shades of the Accent2 theme color with a gradient effect to each data series. |
| Accent2Bevel | A monochromatic chart style that applies different shades of the Accent2 theme color to each data series and specifies shape effects (such as beveled edges and shadows). |
| Accent2Area | A monochromatic chart style that applies different shades of the Accent2 theme color to each data series and uses this color to fill the plot area. |
| Accent2Dark | A monochromatic chart style that applies different shades of the Accent2 theme color and shape effects to each data series. This style uses the Dark1 theme color to fill the chart area. |
| Accent3 | A monochromatic chart style that applies different shades of the Accent3 theme color to each data series. |
| Accent3Outline | A monochromatic chart style that applies different shades of the Accent3 theme color to each data series and specifies shape outlines. |
| Accent3Gradient | A monochromatic chart style that applies different shades of the Accent3 theme color with a gradient effect to each data series. |
| Accent3Bevel | A monochromatic chart style that applies different shades of the Accent3 theme color to each data series and specifies shape effects (such as beveled edges and shadows). |
| Accent3Area | A monochromatic chart style that applies different shades of the Accent3 theme color to each data series and uses this color to fill the plot area. |
| Accent3Dark | A monochromatic chart style that applies different shades of the Accent3 theme color and shape effects to each data series. This chart style uses the Dark1 theme color to fill the chart area. |
| Accent4 | A monochromatic chart style that applies different shades of the Accent4 theme color to each data series. |
| Accent4Outline | A monochromatic chart style that applies different shades of the Accent4 theme color to each data series and specifies shape outlines. |
| Accent4Gradient | A monochromatic chart style that applies different shades of the Accent4 theme color with a gradient effect to each data series. |
| Accent4Bevel | A monochromatic chart style that applies different shades of the Accent4 theme color to each data series and specifies shape effects (such as beveled edges and shadows). |
| Accent4Area | A monochromatic chart style that applies different shades of the Accent4 theme color to each data series and uses this color to fill the plot area. |
| Accent4Dark | A monochromatic chart style that applies different shades of the Accent4 theme color and shape effects to each data series. This chart style uses the Dark1 theme color to fill the chart area. |
| Accent5 | A monochromatic chart style that applies different shades of the Accent5 theme color to each data series. |
| Accent5Outline | A monochromatic chart style that applies different shades of the Accent5 theme color to each data series and specifies shape outlines. |
| Accent5Gradient | A monochromatic chart style that applies different shades of the Accent5 theme color with a gradient effect to each data series. |
| Accent5Bevel | A monochromatic chart style that applies different shades of the Accent5 theme color to each data series and specifies shape effects (such as beveled edges and shadows). |
| Accent5Area | A monochromatic chart style that applies different shades of the Accent5 theme color to each data series and uses this color to fill the plot area. |
| Accent5Dark | A monochromatic chart style that applies different shades of the Accent5 theme color and shape effects to each data series. This chart style uses the Dark1 theme color to fill the chart area. |
| Accent6 | A monochromatic chart style that applies different shades of the Accent6 theme color to each data series. |
| Accent6Outline | A monochromatic chart style that applies different shades of the Accent6 theme color to each data series and specifies shape outlines. |
| Accent6Gradient | A monochromatic chart style that applies different shades of the Accent6 theme color with a gradient effect to each data series. |
| Accent6Bevel | A monochromatic chart style that applies different shades of the Accent6 theme color to each data series and specifies shape effects (such as beveled edges and shadows). |
| Accent6Area | A monochromatic chart style that applies different shades of the Accent6 theme color to each data series and uses this color to fill the plot area. |
| Accent6Dark | A monochromatic chart style that applies different shades of the Accent6 theme color and shape effects to each data series. This chart style uses the Dark1 theme color to fill the chart area. |
| Custom | A custom chart style. Use the Chart. |
| Style1 | Corresponds to Style 1 from the Chart Styles gallery in Microsoft® Excel® 2016 and higher. Applies to the following chart types: waterfall, box and whisker, histogram, sunburst, funnel, Pareto, and treemap. |
| Style2 | Corresponds to Style 2 from the Chart Styles gallery in Microsoft® Excel® 2016 and higher. Applies to the following chart types: waterfall, box and whisker, histogram, sunburst, funnel, Pareto, and treemap. |
| Style3 | Corresponds to Style 3 from the Chart Styles gallery in Microsoft® Excel® 2016 and higher. Applies to the following chart types: waterfall, box and whisker, histogram, sunburst, funnel, Pareto, and treemap. |
| Style4 | Corresponds to Style 4 from the Chart Styles gallery in Microsoft® Excel® 2016 and higher. Applies to the following chart types: waterfall, box and whisker, histogram, sunburst, funnel, Pareto, and treemap. |
| Style5 | Corresponds to Style 5 from the Chart Styles gallery in Microsoft® Excel® 2016 and higher. Applies to the following chart types: waterfall, box and whisker, histogram, sunburst, funnel, Pareto, and treemap. |
| Style6 | Corresponds to Style 6 from the Chart Styles gallery in Microsoft® Excel® 2016 and higher. Applies to the following chart types: waterfall, box and whisker, histogram, sunburst, funnel, Pareto, and treemap. |
| Style7 | Corresponds to Style 7 from the Chart Styles gallery in Microsoft® Excel® 2016 and higher. Applies to the following chart types: waterfall, sunburst, funnel, and treemap. |
| Style8 | Corresponds to Style 8 from the Chart Styles gallery in Microsoft® Excel® 2016 and higher. Applies to the following chart types: waterfall, sunburst, funnel, and treemap. |
| Style9 | Corresponds to Style 9 from the Chart Styles gallery in Microsoft® Excel® 2016 and higher. Applies to the following chart types: funnel and treemap. |
#Remarks
Use the Style property to apply one of the predefined styles to an existing chart. Each style specifies data series colors, sets the chart’s background fill, and applies different shape effects and outlines to the chart.
The chart appearance to which a style is applied depends on the current document theme. Each theme has a color palette used to specify chart colors. You can select a colorful chart style that applies one of six accent colors to each series, or use a monochromatic style that applies different shades of the same color to each series.
The example below demonstrates how to create a chart and apply one of the predefined styles to it using the ChartObject.Style property.
Worksheet worksheet = workbook.Worksheets["chartTask3"];
workbook.Worksheets.ActiveWorksheet = worksheet;

// Create a chart and specify its location.
Chart chart = worksheet.Charts.Add(ChartType.ColumnClustered, worksheet["B2:D4"]);
chart.TopLeftCell = worksheet.Cells["H2"];
chart.BottomRightCell = worksheet.Cells["N14"];

// Set the chart style.
chart.Style = ChartStyle.Accent1Dark;
#Excel 2016 Chart Styles
Use styles from Style1 to Style9 for Excel 2016 charts. The following table lists supported styles for each chart:
| Chart Type | Supported Styles |
|---|---|
| Waterfall | Style1 through Style8 |
| Box and Whisker | Style1 through Style6 |
| Histogram | Style1 through Style6 |
| Pareto | Style1 through Style6 |
| Sunburst | Style1 through Style8 |
| Funnel | Style1 through Style9 |
| Treemap | Style1 through Style9 |
The ChartObject.ColorPalette property allows you to change chart colors.
The example below demonstrates how to create a waterfall chart and specify its colors and style.
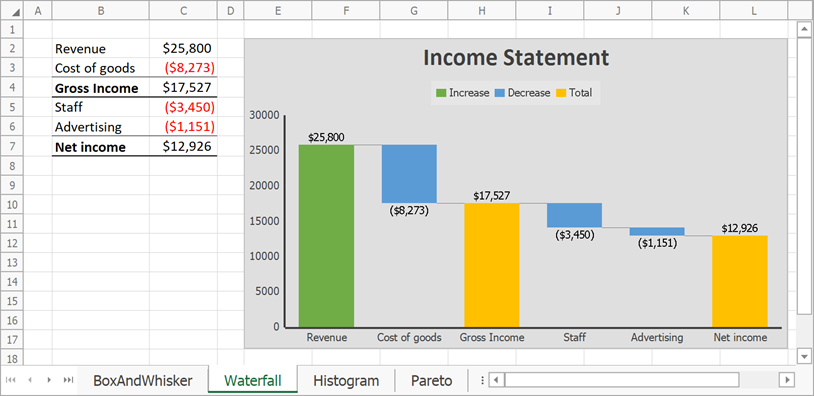
// Create a waterfall chart and specify its location.
Chart chart = worksheet.Charts.Add(ChartType.Waterfall, worksheet["B2:C7"]);
chart.TopLeftCell = worksheet.Cells["E2"];
chart.BottomRightCell = worksheet.Cells["L17"];

// Hide the major gridlines for the value axis.
chart.PrimaryAxes[1].MajorGridlines.Visible = false;

// Specify series options.
var options = chart.Series[0].LayoutOptions.Waterfall;
// Display connector lines.
options.ShowConnectorLines = true;
// Set the third data point as the total.
options.SubtotalDataPoints.Add(2);
// Set the last data point as the total.
options.SubtotalDataPoints.Add(5);

// Specify the chart style.
chart.Style = ChartStyle.Style3;
// Change chart colors.
chart.ColorPalette = ChartColorPalette.Colorful4;

// Add the chart title.
chart.Title.Visible = true;
chart.Title.SetValue("Income Statement");
#Custom Style
Use the ChartObject.LoadStyle method to load a custom style from an XML file and apply it to an Excel 2016 chart.
The code sample below applies a custom style to a waterfall chart. The style.xml file contains a definition of a standard style used for histogram and funnel charts.
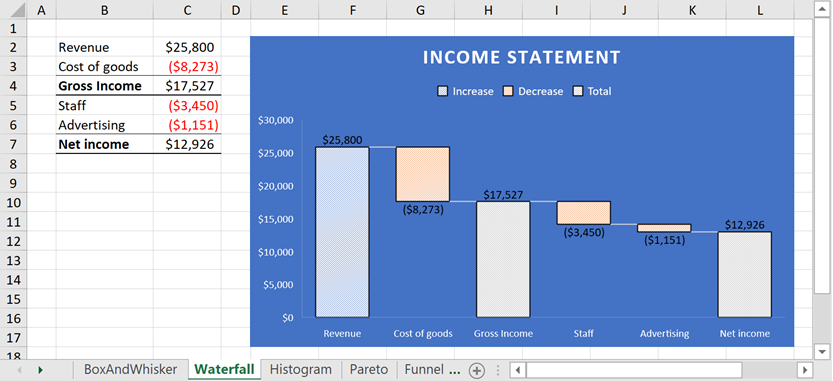
// Create a waterfall chart and specify its location.
Chart chart = worksheet.Charts.Add(ChartType.Waterfall, worksheet["B2:C7"]);
chart.TopLeftCell = worksheet.Cells["E2"];
chart.BottomRightCell = worksheet.Cells["L17"];

// Hide the major gridlines for the value axis.
chart.PrimaryAxes[1].MajorGridlines.Visible = false;

// Specify series options.
var options = chart.Series[0].LayoutOptions.Waterfall;
// Display connector lines.
options.ShowConnectorLines = true;
// Set the third data point as the total.
options.SubtotalDataPoints.Add(2);
// Set the last data point as the total.
options.SubtotalDataPoints.Add(5);

// Load a custom style
// and apply it to the chart.
chart.LoadStyle(@"CustomStyles\style.xml");

// Add the chart title.
chart.Title.Visible = true;
chart.Title.SetValue("Income Statement");
#Related GitHub Examples
The following code snippets (auto-collected from DevExpress Examples) contain references to the Style property.
Note
The algorithm used to collect these code examples remains a work in progress. Accordingly, the links and snippets below may produce inaccurate results. If you encounter an issue with code examples below, please use the feedback form on this page to report the issue.