Series.LayoutOptions Property
Returns series layout options for Excel 2016 charts.
Namespace: DevExpress.Spreadsheet.Charts
Assembly: DevExpress.Spreadsheet.v26.1.Core.dll
Declaration
Property Value
| Type | Description |
|---|---|
| SeriesLayoutOptions | An object that contains series options for Excel 2016 charts. |
Remarks
Use the SeriesLayoutOptions object’s members to specify options for Excel 2016 charts.
Box and Whisker Chart
Use the Series.LayoutOptions.BoxAndWhisker property to define options for a box and whisker data series.
| Property | Description |
|---|---|
| BoxAndWhiskerSeriesOptions.ShowInnerPoints | Specifies whether to show inner data points that lie between the lower and upper whisker lines. |
| BoxAndWhiskerSeriesOptions.ShowOutlierPoints | Specifies whether to show outlier data points that lie either below the lower whisker line or above the upper whisker line. |
| BoxAndWhiskerSeriesOptions.ShowMeanLine | Specifies whether to display a line that connects the means of boxes in the series. |
| BoxAndWhiskerSeriesOptions.ShowMeanMarkers | Specifies whether to show the mean markers. |
| BoxAndWhiskerSeriesOptions.QuartileCalculationMethod | Defines the quartile calculation method. |
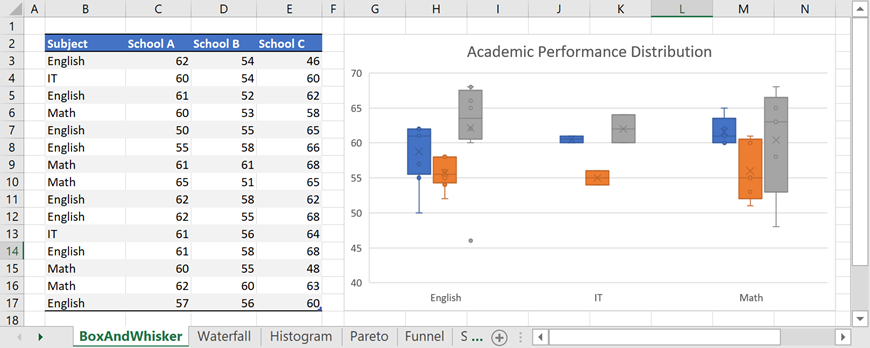
// Create a box and whisker chart and specify its location.
Chart chart = worksheet.Charts.Add(ChartType.BoxAndWhisker, worksheet["B2:E17"]);
chart.TopLeftCell = worksheet.Cells["G2"];
chart.BottomRightCell = worksheet.Cells["N17"];

// Set the minimum and maximum values for the value axis.
Axis axis = chart.PrimaryAxes[1];
axis.Scaling.AutoMax = false;
axis.Scaling.Max = 70;
axis.Scaling.AutoMin = false;
axis.Scaling.Min = 40;

// Specify series options.
foreach (Series series in chart.Series)
{
    var options = series.LayoutOptions.BoxAndWhisker;
    options.ShowInnerPoints = true;
    options.ShowMeanLine = false;
    options.ShowOutlierPoints = true;
    options.ShowMeanMarkers = true;
    options.QuartileCalculationMethod = QuartileCalculationMethod.ExclusiveMedian;
}

// Add the chart title.
chart.Title.Visible = true;
chart.Title.SetValue("Academic Performance Distribution");
Waterfall Chart
Use the Series.LayoutOptions.Waterfall property to specify options for a waterfall data series.
| Property | Description |
|---|---|
| WaterfallSeriesOptions.ShowConnectorLines | Specifies whether to display connector lines between data points. |
| WaterfallSeriesOptions.SubtotalDataPoints | Returns a collection of total points. |
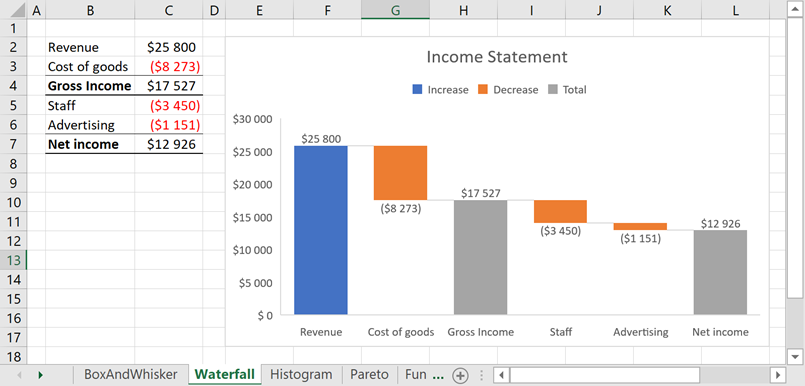
// Create a waterfall chart and specify its location.
Chart chart = worksheet.Charts.Add(ChartType.Waterfall, worksheet["B2:C7"]);
chart.TopLeftCell = worksheet.Cells["E2"];
chart.BottomRightCell = worksheet.Cells["L17"];

// Hide the major gridlines for the value axis.
chart.PrimaryAxes[1].MajorGridlines.Visible = false;

// Specify series options.
var options = chart.Series[0].LayoutOptions.Waterfall;
// Display connector lines.
options.ShowConnectorLines = true;
// Set the third data point as the total.
options.SubtotalDataPoints.Add(2);
// Set the last data point as the total.
options.SubtotalDataPoints.Add(5);

// Add the chart title.
chart.Title.Visible = true;
chart.Title.SetValue("Income Statement");
Histogram Chart
Use the Series.LayoutOptions.Histogram property to specify options for a histogram data series.
| Property | Description |
|---|---|
| HistogramSeriesOptions.BinType | Specifies how to calculate bins for a histogram. |
| HistogramSeriesOptions.BinCount | Defines the number of histogram bins. |
| HistogramSeriesOptions.BinWidth | Defines the bin size. |
| HistogramSeriesOptions.OverflowType, HistogramSeriesOptions.OverflowValue |
Allow you to create a bin for all values that are above a specific value. |
| HistogramSeriesOptions.UnderflowType, HistogramSeriesOptions.UnderflowValue |
Allow you to create a bin for all values that are below or equal to a specific value. |
| HistogramSeriesOptions.IntervalClosedSide | Specifies the bin closed side. |
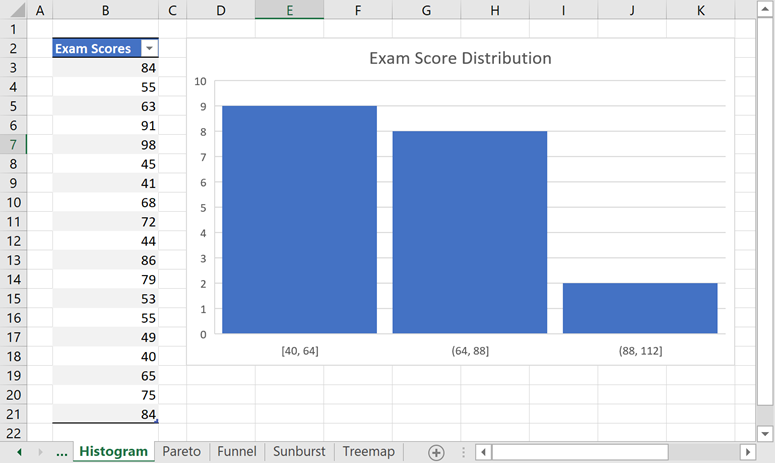
// Create a histogram chart and specify its location.
Chart chart = worksheet.Charts.Add(ChartType.Histogram, worksheet["B2:B21"]);
chart.TopLeftCell = worksheet.Cells["D2"];
chart.BottomRightCell = worksheet.Cells["K18"];

// Specify histogram series options.
var options = chart.Series[0].LayoutOptions.Histogram;
options.BinType = HistogramBinType.BinWidth;
options.BinWidth = 24;
// Specify the gap width.
chart.Series[0].GapWidth = 10;

// Add the chart title.
chart.Title.Visible = true;
chart.Title.SetValue("Exam Score Distribution");
Pareto Chart
Use the Series.LayoutOptions.Histogram property to specify bin options for a Pareto data series.

// Create a Pareto chart and specify its location.
Chart chart = worksheet.Charts.Add(ChartType.Pareto, worksheet["B2:C7"]);
chart.TopLeftCell = worksheet.Cells["E2"];
chart.BottomRightCell = worksheet.Cells["L17"];

// Specify series options.
var options = chart.Series[0].LayoutOptions.Histogram;
options.BinType = HistogramBinType.ByCategory;
// Specify the gap width.
chart.Series[0].GapWidth = 15;

// Add the chart title.
chart.Title.Visible = true;
chart.Title.SetValue("Key Causes of Late Projects");
Treemap Chart
Use the Series.LayoutOptions.Treemap property to specify options for a treemap data series.
| Property | Description |
|---|---|
| TreemapSeriesOptions.ParentLabelLayout | Defines the layout of parent labels. |
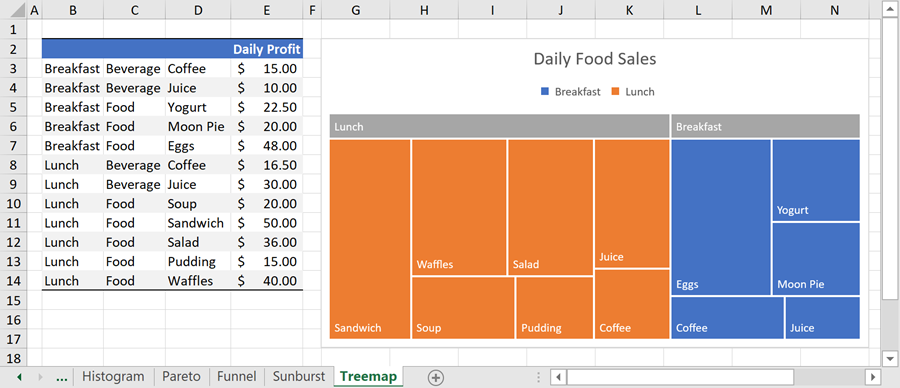
// Create a treemap chart and specify its location.
Chart chart = worksheet.Charts.Add(ChartType.Treemap, worksheet["B2:E14"]);
chart.TopLeftCell = worksheet.Cells["G2"];
chart.BottomRightCell = worksheet.Cells["N17"];

// Specify series options.
var options = chart.Series[0].LayoutOptions.Treemap;
options.ParentLabelLayout = TreemapParentLabelLayout.Banner;

// Add the chart title.
chart.Title.Visible = true;
chart.Title.SetValue("Daily Food Sales");