Axis Interface
Represents an axis on a chart.
Namespace: DevExpress.Spreadsheet.Charts
Assembly: DevExpress.Spreadsheet.v24.2.Core.dll
NuGet Package: DevExpress.Spreadsheet.Core
#Declaration
#Remarks
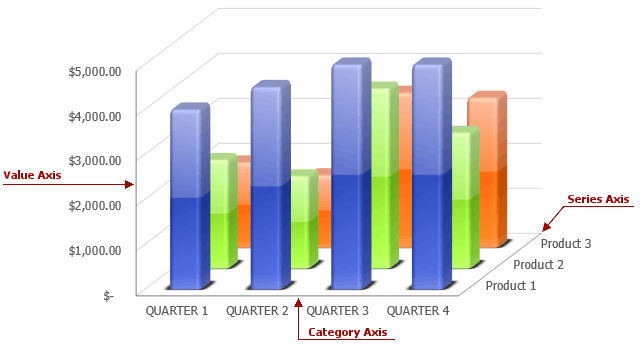
Most charts have two axes: the category axis, usually running horizontally along the bottom of the plot area, and the value axis, usually running vertically on the left side of the plot area. 3-D charts also have the depth (series) axis along which the series names are displayed. But not all charts display axes the same way. For example, a scatter chart always has two value axes, while pie and doughnut charts have no axes at all.
All primary axes are stored in the axis collection (AxisCollection), accessible via the ChartObject.PrimaryAxes property. You can get an individual axis defined by the Axis object by its index in the collection. Use the object’s properties to modify the axis: set the axis position (Axis.Position), adjust axis scaling (Axis.Scaling), display major (Axis.MajorTickMarks) and minor (Axis.MinorTickMarks) tick marks, change the interval of axis tick marks (by setting Axis.MajorUnit and Axis.MinorUnit), apply a number format to tick-mark labels (Axis.NumberFormat), add the axis title (Axis.Title), adjust axis appearance, etc.
In addition to primary axes, a chart also may have a collection of secondary axes, accessible via the ChartObject.SecondaryAxes property. To create a secondary axes group for a specific series, set the Series.AxisGroup property to AxisGroup.Secondary.