HistogramSeriesOptions.BinType Property
Specifies how to calculate bin intervals for a histogram.
Namespace: DevExpress.Spreadsheet.Charts
Assembly: DevExpress.Spreadsheet.v26.1.Core.dll
Declaration
Property Value
| Type | Description |
|---|---|
| HistogramBinType | An enumeration member that specifies how to calculate histogram bins. |
Available values:
| Name | Description |
|---|---|
| Automatic | The bin width is calculated automatically. |
| BinWidth | Uses the HistogramSeriesOptions.BinWidth property to define the width of histogram bins. |
| BinCount | Uses the HistogramSeriesOptions.BinCount property to define the number of histogram bins. |
| ByCategory | Groups the same categories and sums values in the value axis. Applies only to the text-based category axis. |
Property Paths
You can access this nested property as listed below:
| Object Type | Path to BinType |
|---|---|
| SeriesLayoutOptions |
|
Remarks
The example below creates a histogram with a custom bin size. Set the BinType option to HistogramBinType.BinWidth and use the HistogramSeriesOptions.BinWidth property to define the desired width for histogram bins.
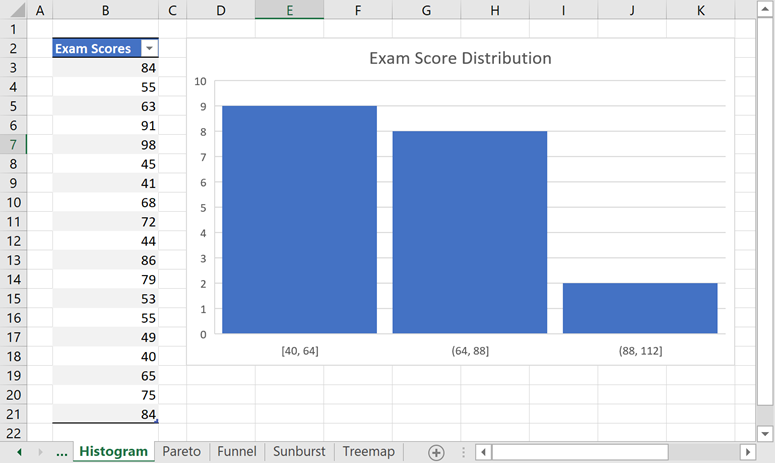
// Create a histogram chart and specify its location.
Chart chart = worksheet.Charts.Add(ChartType.Histogram, worksheet["B2:B21"]);
chart.TopLeftCell = worksheet.Cells["D2"];
chart.BottomRightCell = worksheet.Cells["K18"];

// Specify histogram series options.
var options = chart.Series[0].LayoutOptions.Histogram;
options.BinType = HistogramBinType.BinWidth;
options.BinWidth = 24;
// Specify the gap width.
chart.Series[0].GapWidth = 10;

// Add the chart title.
chart.Title.Visible = true;
chart.Title.SetValue("Exam Score Distribution");