Zoom and Scroll in 2D XY-Charts
- 11 minutes to read
This document explains how to navigate through a 2D chart. Users can scroll a chart along argument and value axes to pan a chart horizontally and vertically, and zoom a chart in/out.
Note
The WebChartControl cannot be zoomed and scrolled.
This help file explains how to:
- Allow Users to Zoom a Chart
- Zoom a Chart
- Use API to Zoom a Chart
- Allow Users to Scroll a Chart
- Scroll a Chart
- Use API to Scroll a Chart
- Customize Scroll Bar Appearance
- Specify Keyboard Shortcuts and Mouse Actions
Allow Users to Zoom a Chart
The Chart control allows you to enable the capability to zoom a chart’s x-axis, y-axis or both axes.
XYDiagram xyDiagram = (XYDiagram)chartControl.Diagram;
xyDiagram.EnableAxisXZooming = true;
xyDiagram.EnableAxisYZooming = true;
The code listed above uses the following API members:
| Member | Description |
|---|---|
| XYDiagram2D.EnableAxisXZooming | Indicates whether a user can zoom a chart’s x-axis. |
| XYDiagram2D.EnableAxisYZooming | Indicates whether a user can zoom a chart’s y-axis. |
Use the XYDiagramPaneBase.EnableAxisXZooming and XYDiagramPaneBase.EnableAxisYZooming properties to define whether a user can zoom a diagram within a separate pane.
A chart cannot be zoomed more than the maximum zoom factor (100 times (10000%)). The mouse pointer changes to  when a user achieves the maximum zoom. Use the ZoomingOptions2D.AxisXMaxZoomPercent and ZoomingOptions2D.AxisYMaxZoomPercent properties to specify a zoom factor’s limits.
Zoom a Chart
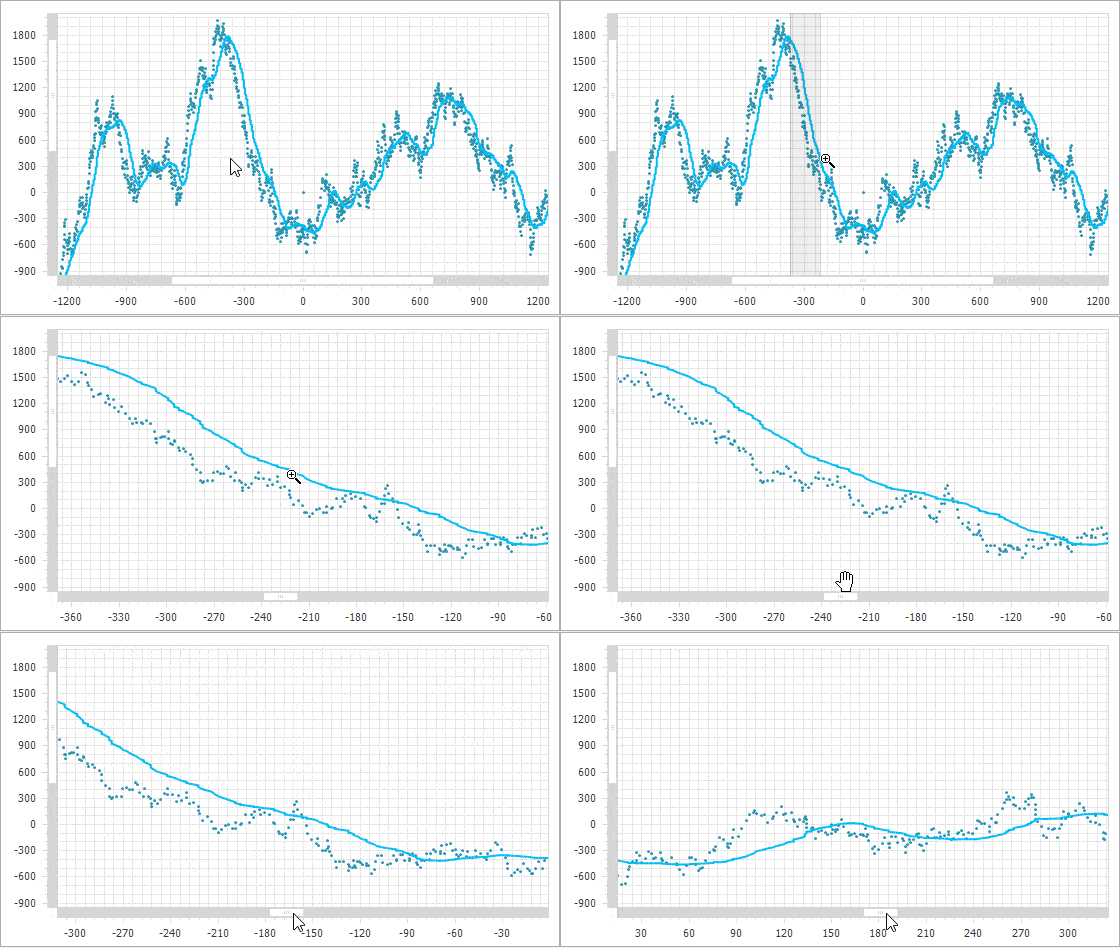
Users can use a keyboard and/or mouse, and spread/pinch gestures on touchscreen devices to zoom a chart:
xyDiagram.ZoomingOptions.UseKeyboard = true;
xyDiagram.ZoomingOptions.UseKeyboardWithMouse = true;
xyDiagram.ZoomingOptions.UseMouseWheel = true;
xyDiagram.ZoomingOptions.UseTouchDevice = true;
The code above uses the following API members:
| Member | Description |
|---|---|
| XYDiagram2D.ZoomingOptions | Returns zooming options for the XY-Diagram. |
| ZoomingOptions.UseKeyboard | Specifies whether a user can use a keyboard to zoom a chart. |
| ZoomingOptions.UseKeyboardWithMouse | Defines whether a user can use a keyboard and/or mouse to zoom a chart. |
| ZoomingOptions.UseMouseWheel | Defines whether a user can use a mouse wheel to zoom a chart. |
| ZoomingOptions.UseTouchDevice | Specifies whether a user can use touchscreen devices to zoom a chart. |
You can use the following actions to zoom a diagram:
Action | Effect |
|---|---|
Press Shift and click the diagram. | The mouse pointer changes to |
Press Alt and click the diagram. | The mouse pointer changes to |
Press Shift and select a region on the diagram. | The mouse pointer changes to
A chart is zoomed into the selected region bounds after a user releases the left mouse button. |
Use Ctrl with the + or - key. | A chart’s diagram is zoomed in by 20 percent from the current axis ranges if a user presses and holds the Ctrl key with the + key. A chart’s diagram is zoomed out by 20 percent from the current axis ranges if a user presses and holds the Ctrl key with the - key. |
Use the mouse wheel. | A user should hover a diagram with the mouse pointer and scroll the mouse wheel to zoom in/out by 20 percent from the current ranges of axes. To zoom in/out a chart by an individual axis, they should hover the axis with the mouse pointer and scroll the mouse wheel. |
Use the spread or pinch gestures on a touchscreen device. | Spread or pinch gestures allow a user to zoom in and out a diagram on any touchscreen devices.
|
Use Ctrl + Z. | Users should press the Ctrl + Z keys to return the previous zoom state of a diagram. Note that all subsequent operations of a similar kind (for example, multiple “zoom in” operations) are considered as a single transaction. A press of Ctrl + Z returns the zoom state existed before the first zoom operation in a zoom series. |
Use API to Zoom a Chart
Use the following methods to zoom in/out a chart programmatically:
Use the XYDiagram2D.ResetZoom method to set visual range values to whole range values.
The ChartControl.Zoom event allows you to track how axis ranges change when a user zooms a chart. The ChartControl.BeforeZoom event allows you to use the ChartBeforeZoomEventArgs.Cancel property to cancel a zoom operation:
void chart_BeforeZoom(object sender, ChartBeforeZoomEventArgs e) {
    if (!(e.Axis is AxisX))
        return;
    double rangeLengthInMeasureUnits = e.NewRange.Max - e.NewRange.Min;
    if (rangeLengthInMeasureUnits > MaxZoomPointCount)
        e.Cancel = true;
}
void chart_Zoom(object sender, ChartZoomEventArgs e) {
    double rangeLengthInMeasureUnits = e.NewXRange.Max - e.NewXRange.Min;
    if (rangeLengthInMeasureUnits > 1.2 * InitialPointCountOnScreen)
        VolumeSeriesView.BarWidth = 1;
    else
        VolumeSeriesView.BarWidth = 0.6;
}
The code above uses the following API members:
| Member | Description |
|---|---|
| ChartControl.Zoom | Occurs when a user zooms in/out of a chart. |
| ChartZoomEventArgs | Provides the ChartControl.Zoom event data. |
| ChartControl.BeforeZoom | Occurs before the chart is zoomed. |
| ChartBeforeZoomEventArgs | Provides the ChartControl.BeforeZoom event data. |
You can also specify an axis’s visual or whole range to zoom a chart. See the following section for more information: Configure Visual and Whole Ranges.
The following code makes a chart display data for a specific range when a user clicks a button:
private void simpleButton1_OnClick(object sender, EventArgs e) {
    Range range = ((XYDiagram)chartControl1.Diagram).AxisX.VisualRange;
    range.MinValue = new DateTime(2019, 6, 1, 12, 0, 0);
    range.MaxValue = new DateTime(2019, 6, 2, 3, 0, 0);
}
Allow Users to Scroll a Chart
Users can scroll a diagram to navigate on a chart when they zoom in a diagram or when an axis’s visual range is less than its whole range. The Chart control allows you to enable scrolling for x and y-axis separately:
XYDiagram diagram = (XYDiagram)chartControl.Diagram;
diagram.EnableAxisXScrolling = true;
diagram.EnableAxisYScrolling = true;
The code above uses the following API members:
| Member | Description |
|---|---|
| XYDiagram2D.EnableAxisXScrolling | Indicates whether a user can scroll a diagram by an x-axis. |
| XYDiagram2D.EnableAxisYScrolling | Indicates whether a user can scroll a diagram by a y-axis. |
Use the XYDiagramPaneBase.EnableAxisXScrolling and XYDiagramPaneBase.EnableAxisYScrolling properties to define whether a user can scroll a diagram within a separate pane.
Scroll a Chart
Users can utilize a mouse, keyboard, scroll bars and flick gestures on touchscreen devices to move through a diagram:
xyDiagram.ScrollingOptions.UseKeyboard = true;
xyDiagram.ScrollingOptions.UseMouse = true;
xyDiagram.ScrollingOptions.UseScrollBars = true;
xyDiagram.ScrollingOptions.UseTouchDevice = true;
The code above uses the following API members:
| Member | Description |
|---|---|
| XYDiagram2D.ScrollingOptions | Provides access to the options specifying the ways in which scrolling can be performed for a 2D XY-Diagram. |
| ScrollingOptions.UseKeyboard | Specifies whether a user can use a keyboard to scroll a chart. |
| ScrollingOptions.UseMouse | Defines whether a user can use a mouse to scroll a chart. |
| ScrollingOptions2D.UseScrollBars | Specifies whether a user can use scroll bars to scroll a chart. |
| ScrollingOptions2D.UseTouchDevice | Defines whether a user can use touchscreen devices to scroll a chart. |
The following actions scroll a diagram:
Action | Effect |
|---|---|
Press the left mouse button or wheel button, and drag the mouse pointer. | The mouse pointer changes from |
Use axes’ scroll bars. | A user can click a scrollbar arrow or the scrollbar near the thumb, or drag the thumb and move it. |
Use Ctrl + Arrow keys (Left, Up, Right or Down). | A diagram is moved to the left if a user presses Ctrl + Left. A diagram is moved up if a user presses Ctrl + Up. A diagram is moved to the right if a user presses Ctrl + Right. A diagram is moved down if a user presses Ctrl + Down. |
Use flick gestures on a touchscreen device. | Flick gestures allows a user to scroll a diagram on touchscreen devices.
|
Use API to Scroll a Chart
Use the XYDiagram2D.Scroll method to scroll a chart in code.
xyDiagram.Scroll(HorizontalScrollingDirection.Right, VerticalScrollingDirection.Up, xyDiagram.DefaultPane);
The code listed above uses the following API members:
| Member | Description |
|---|---|
| XYDiagram2D.Scroll | Scrolls a chart in a given direction. |
| HorizontalScrollingDirection | Enumerates the possible horizontal scrolling directions. |
| VerticalScrollingDirection | Enumerates the possible vertical scrolling directions. |
Handle the ChartControl.Scroll event to provide a custom functionality when a chart is being scrolled.
chartControl.Scroll += ChartControl_Scroll;
// ...
private void ChartControl_Scroll(object sender, ChartScrollEventArgs e) {
    // Your custom logic here.
}
The previously mentioned code uses the following API members:
| Member | Description |
|---|---|
| ChartControl.Scroll | Occurs when an end-user scrolls the ChartControl. |
| ChartScrollEventArgs | Provides data for the ChartControl.Scroll event. |
Customize Scroll Bar Appearance
You can change a background color of scroll bars, their border’s color and thickness, and specify scroll bar position.
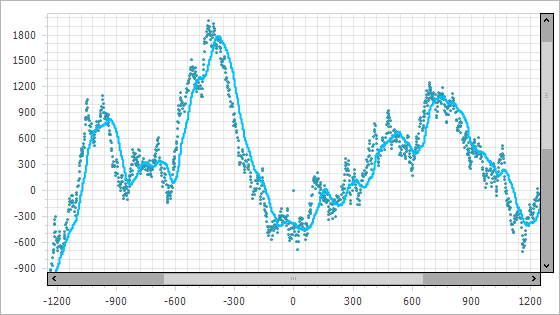
The following code configures scroll bar position, visibility and position:
xyDiagram.DefaultPane.ScrollBarOptions.XAxisScrollBarAlignment = ScrollBarAlignment.Near;
xyDiagram.DefaultPane.ScrollBarOptions.YAxisScrollBarAlignment = ScrollBarAlignment.Far;
xyDiagram.DefaultPane.ScrollBarOptions.XAxisScrollBarVisible = true;
xyDiagram.DefaultPane.ScrollBarOptions.YAxisScrollBarVisible = true;
xyDiagram.DefaultPane.ScrollBarOptions.BarThickness = 10;
xyDiagram.DefaultPane.ScrollBarOptions.BackColor = Color.DarkGray;
xyDiagram.DefaultPane.ScrollBarOptions.BarColor = Color.LightGray;
xyDiagram.DefaultPane.ScrollBarOptions.BorderColor = Color.Black;
The table below lists the API members you can use to customize scroll bars:
| Member | Description |
|---|---|
| XYDiagramPaneBase.ScrollBarOptions | Gets the specific settings of scroll bars displayed within the pane while a user zooms or scrolls a chart. |
| ScrollBarOptions.XAxisScrollBarAlignment | Specifies the x-axis scroll bar’s alignment. |
| ScrollBarOptions.YAxisScrollBarAlignment | Specifies the y-axis scroll bar’s alignment. |
| ScrollBarAlignment | Lists scroll bars’ alignments. |
| ScrollBarOptions.XAxisScrollBarVisible | Gets or sets the x-axis scroll bar’s visibility. |
| ScrollBarOptions.YAxisScrollBarVisible | Gets or sets the y-axis scroll bar’s visibility. |
| ScrollBarOptions.BarThickness | Specifies scroll boxes’ thickness. |
| ScrollBarOptions.BackColor | Specifies the background color of scroll bars. |
| ScrollBarOptions.BarColor | Gets or sets the scroll box color. |
| ScrollBarOptions.BorderColor | Gets or sets the scroll bar border color. |
Specify Keyboard Shortcuts and Mouse Actions
The Chart control allows you to assign keyboard shortcuts to the following actions:
| Action | Shortcut key collection |
|---|---|
| Scroll down | ScrollingOptions.ScrollDownShortcuts |
| Scroll left | ScrollingOptions.ScrollLeftShortcuts |
| Scroll right | ScrollingOptions.ScrollRightShortcuts |
| Scroll up | ScrollingOptions.ScrollUpShortcuts |
| Undo zoom | ZoomingOptions.UndoZoomShortcuts |
| Zoom in | ZoomingOptions.ZoomInShortcuts |
| Zoom out | ZoomingOptions.ZoomOutShortcuts |
The following code assigns keyboard shortcut keys to the ScrollLeft, ScrollUp, ScrollRight, and ScrollDown operations:
// Use Shift + A or the Left arrow to move a diagram to the left.
xyDiagram.ScrollingOptions.ScrollLeftShortcuts.Add(Keys.Shift | Keys.A);
xyDiagram.ScrollingOptions.ScrollLeftShortcuts.Add(Keys.Left);
// Use Shift + W or the Up arrow to move a diagram up.
xyDiagram.ScrollingOptions.ScrollUpShortcuts.Add(Keys.Shift | Keys.W);
xyDiagram.ScrollingOptions.ScrollUpShortcuts.Add(Keys.Up);
// Use Shift + D or the Right arrow to move a diagram to the right.
xyDiagram.ScrollingOptions.ScrollRightShortcuts.Add(Keys.Shift | Keys.D);
xyDiagram.ScrollingOptions.ScrollRightShortcuts.Add(Keys.Right);
// Use Shift + S or the Down arrow to move a diagram down.
xyDiagram.ScrollingOptions.ScrollDownShortcuts.Add(Keys.Shift | Keys.S);
xyDiagram.ScrollingOptions.ScrollDownShortcuts.Add(Keys.Down);
You can change the predefined mouse button + keyboard key combination for the following actions:
| Action | Property |
|---|---|
| Zoom in | ZoomingOptions.ZoomInMouseAction |
| Zoom out | ZoomingOptions.ZoomOutMouseAction |
| Zoom to rectangle | ZoomingOptions2D.ZoomToRectangleMouseAction |
| Scroll | ScrollingOptions.ScrollMouseAction |
The following code specifies the ZoomIn and ZoomOut actions:
XYDiagram xyDiagram = chartControl.Diagram as XYDiagram;
if(xyDiagram != null) {
    xyDiagram.ZoomingOptions.ZoomInMouseAction.ModifierKeys = ChartModifierKeys.Control;
    xyDiagram.ZoomingOptions.ZoomInMouseAction.MouseButton = MouseButtons.Right;
    xyDiagram.ZoomingOptions.ZoomOutMouseAction.ModifierKeys = ChartModifierKeys.Shift;
    xyDiagram.ZoomingOptions.ZoomOutMouseAction.MouseButton = MouseButtons.Right;
}
The code above uses the following API members:
| Member | Description |
|---|---|
| ChartMouseAction.MouseButton | Gets or sets the mouse button the end user should use to interact with the chart. |
| ChartMouseAction.ModifierKeys | Gets or sets the modifier keys. |
 after a user presses the Shift key. They should move the mouse pointer to the chart region they want to zoom and click the left mouse button with Shift pressed. This zooms in the diagram 3 times.
 after a user presses the Alt key. They should move the mouse pointer to the region to be zoomed out, and click the left mouse button with Alt pressed. The diagram is zoomed out by 3 times.


 to
to  after a user holds down the left mouse button. Users should move the mouse pointer with the left mouse button pressed to scroll a diagram in the same direction as the mouse pointer is moved.