Animate Series Points
- 2 minutes to read
This topic explains how to animate series points and customize their animation settings for both 2D and 3D chart types.
Series Points Animation in 2D Charts
Series points can be animated using either built-in or custom animation effects.
If you wish to apply the built-in animation effect to chart elements (Series and/or Series Points, depending on a given series), specify the chart animation mode using the ChartControl.AnimationMode property.
Note
To obtain the list of all animations that are available for a given series, use the Series.GetPredefinedSeriesAnimationKinds and Series.GetPredefinedPointAnimationKinds methods.
To specify custom animation for series points, assign an animation effect to the PointAnimation property of the series (e.g., AreaSeries2D.PointAnimation).
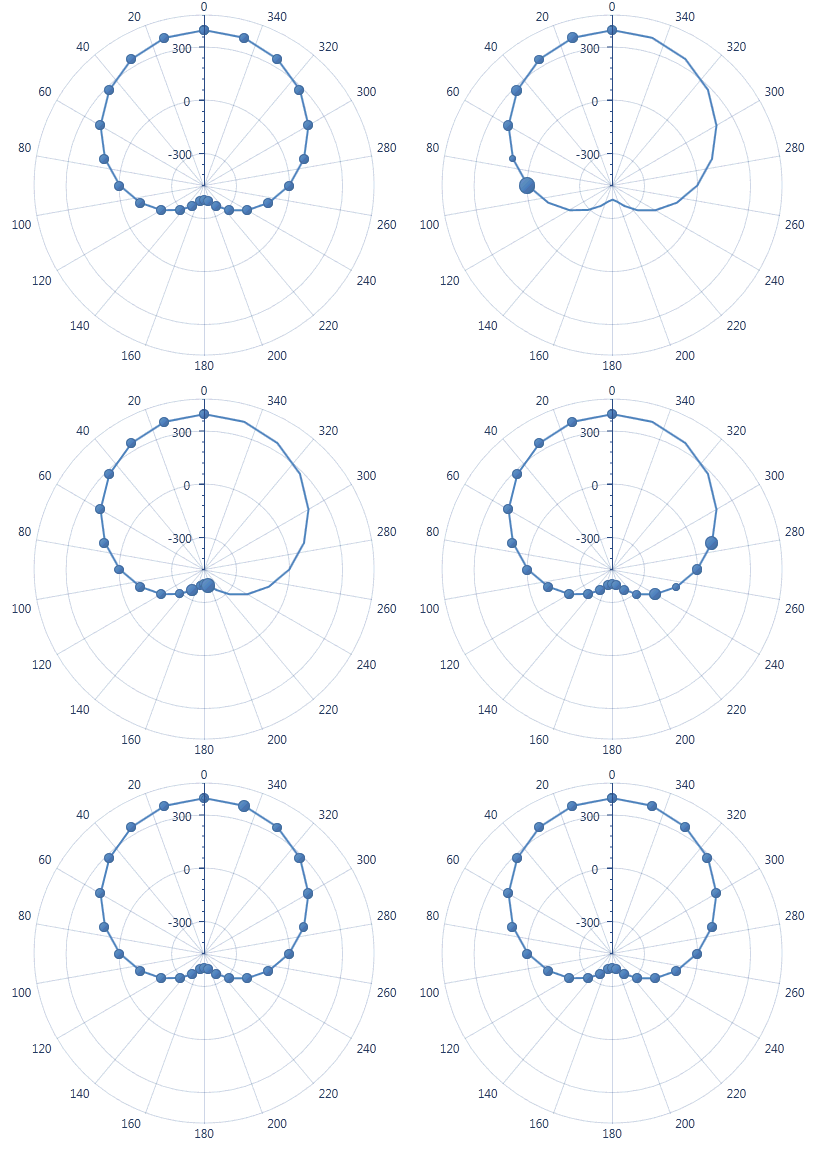
The image below shows the CircularMarkerWidenAnimation effect for the PolarLineSeries2D chart.

Example
The following tutorial shows how to animate a chart’s series points.
The table below lists properties that can be used to customize the animation effect for series points.
| Member | Description |
|---|---|
| SeriesPointAnimationBase.PointDelay | Specifies the delay sustained when animating the series points. This is a dependency property. |
| SeriesPointAnimationBase.PointOrder | Defines the order in which series points are animated. This is a dependency property. |
| AnimationBase.BeginTime | Specifies the time when the animation is started. This is a dependency property. |
| AnimationBase.Duration | Specifies the duration of the animation. This is a dependency property. |
| AnimationBase.EasingFunction | Specifies the easing function for the animation. This is a dependency property. |
Series Points Animation in 3D Charts
3D Chart types support the animation of its series points.

To animate a 3D chart’s series points, do the following:
- add a trigger to the chart’s Triggers collection, which will start the series point’s animation in response to the chart’s Loaded event;
- add a ChartAnimationRecord with the SeriesAnimation object to the ChartControl.AnimationRecords collection;
- add a SeriesSeriesPointsAction object to the SeriesAnimationActionCollection object.
Example
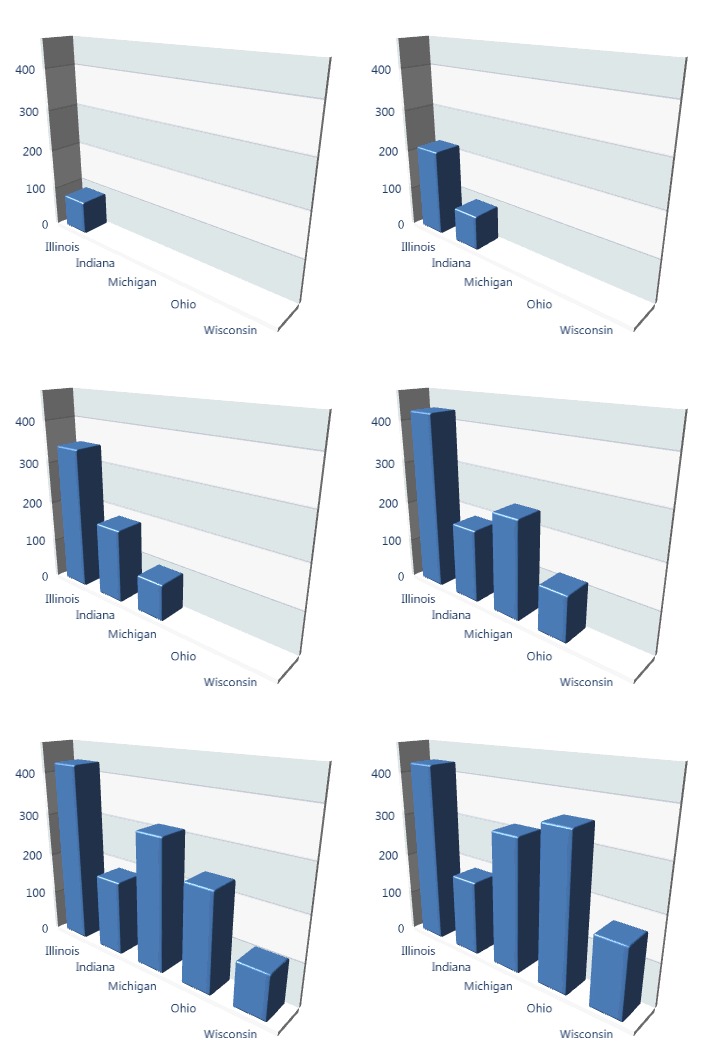
The following example shows how to animate a series point’s argument and value.
To customize the animation effect for both the series and its series points, use the following properties:
| Member | Description |
|---|---|
| ChartControl.AnimationRecords | Provides access to a collection of animation records within a chart. |
| Diagram3DAnimation.Actions | Specifies which parameters of the Diagram3D object should be animated. This is a dependency property. |
| ChartAnimationRecord.Progress | Gets or sets a progress value of the current animation record. |