PivotTable Value Field Settings Dialog
- 4 minutes to read
The Value Field Settings dialog allows end-users to change the calculation and display settings for the PivotTable data fields.
End-users can invoke this dialog by doing the following:
- Select any cell in the data area;
Right-click it and select Value Field Settings… in the context menu…

… or click the Field Settings button. Add the Active Field group to the ribbon to enable this button (see the Create a Simple Spreadsheet Application topic for a demonstration on how to provide the SpreadsheetControl with a Ribbon UI).

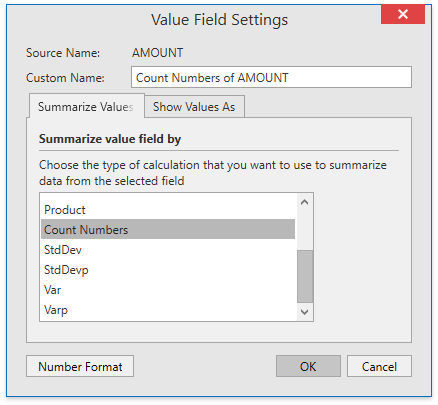
The Value Field Settings dialog includes two tabs: Summarize Values By and Show Values As.
The Custom Name box at the top of the dialog allows end-users to rename the selected field (PivotDataField.Name).
Clicking the Number Format button invokes the Format Cells dialog, which allows end-users to change the default number format applied to the data field (PivotDataField.NumberFormat).
Summarize Values By
This tab allows end-users to change the aggregate function used to summarize the data field values (PivotDataField.SummarizeValuesBy). The default functions are Sum (for numeric fields) and Count (for text fields or fields containing blank cells).
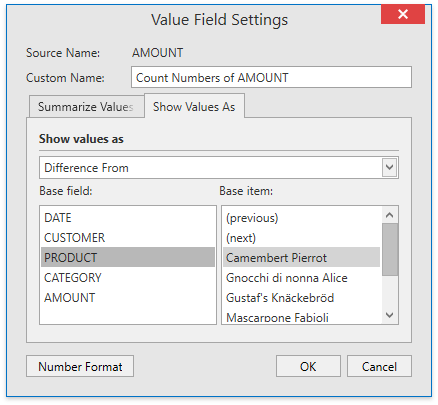
Show Values As
On this tab, end-users can configure how calculation results should be displayed in cells (PivotDataField.ShowValuesAs) by selecting the desired option from the drop-down list. Depending on the selected option, end-users may need to specify either a base field or a base field and its base item to perform a custom calculation.
The table below describes available options that specify how to display summary values within a data field.
Option | Description |
|---|---|
No Calculation | Displays values “as is”. |
% of Grand Total | Displays values as the percentage of the grand total of all values in the PivotTable report. |
% of Column Total | Displays values in each column as the percentage of the column’s total value. |
% of Row Total | Displays values in each row as the percentage of the row’s total value. |
% Of | Displays values as the percentage of the value of the base item in the base field. |
% of Parent Row Total | Displays values in each inner row as the percentage of the total of the parent item in the outer row. |
% Parent of Column Total | Displays values in each inner column as the percentage of the total of the parent item in the outer column. |
% of Parent Total | Displays values in a data field as the percentage of the value of the parent item in the specified base field. |
Difference From | Displays values as the difference from the value of the base item in the base field. |
% Difference From | Displays values as the percentage difference of the value of the base item in the base field. |
Running Total in | Displays values for successive items in the base field as a running total. |
% Running Total in | Calculates a running total for successive items in the base field as a percentage of the grand total value. |
Rank Smallest to Largest | Displays the rank of values for a specific base field, listing the smallest item in the field as 1, and each larger value with a higher rank value. |
Rank Largest to Smallest | Displays the rank of values for a specific base field, listing the largest item in the field as 1, and each smaller value with a higher rank value. |
Index | Calculates the relative importance of each summary value by using the following formula: ((value in cell) x (Grand Total of Grand Totals)) / ((Grand Row Total) x (Grand Column Total)) |
Tip
Use the PivotDataField.SummarizeValuesBy and PivotDataField.ShowValuesAs properties to change calculation settings of a specific data field in code. Refer to the How to: Change the Summary Function for a Data Field and the How to: Apply a Custom Calculation to a Data Field topics for details.