Supported Summarization Options
- 4 minutes to read
A report summary aggregates values across multiple records to calculate totals, averages, counts, and other results. The summarization option determines which calculation method is applied to the selected data field or expression.
Choose a summarization option based on the result you need to display. For cumulative totals, use a running total to accumulate values through the current record or a carryover summary to carry a balance from page to page.
Note
The selected summarization option is converted to an expression bound to the report element’s Text property. Refer to the following help topic for function syntax and examples: Report Summary Functions.
Summarization Options Reference
Select a summarization option from the Summary Functions column in the Report Wizard or the Function combo box in the Summary Editor to specify how values are calculated. The following table describes available options and their typical usage scenarios:
| Option | Description | Usage Scenario |
|---|---|---|
| Average | The average of values. | Calculate the average invoice amount for each customer. |
| Average (Distinct) | The average of unique values. | Calculate the average of ticket prices, regardless of how many tickets were sold at each price. |
| Carryover Summary | Carried-forward and brought-forward totals across report pages. | Display the balance brought forward and balance due on each page of a customer statement. |
| Count | The number of values. | Count invoices issued to each customer. |
| Count (Distinct) | The number of unique values. | Count different products purchased by each customer. |
| Max | The largest value. | Find each customer’s largest invoice. |
| Median | The middle value after sorting (or the average of the two middle values for an even value count). | Find the median household income in a district, where a few very high incomes can disproportionately increase the average. |
| Min | The minimum value. | Find the minimum outstanding invoice for each customer. |
| Percentage | Each record’s value as a percentage of the total. | Display the share of monthly sales for each department. |
| Population Variance | The variance of values treated as an entire population rather than a sample. | Assess the spread of resident ages in a complete town census. |
| Population Variance (Distinct) | The population variance of unique values. | Compare product price variation; count each different price once. |
| Record Number | The current record’s position within the summary range. For a group summary, the number is reset at the start of each group. | Displays number the lines on each invoice. |
| Running Summary | A cumulative total from the start of the summary range through the current record. | Display total payments received so far after each payment. |
| Standard Deviation | The sample standard deviation. | Estimate height variation in an adult population from a sample. |
| Standard Deviation (Distinct) | The sample standard deviation of unique values. | Compare supplier quotes in a sample; count each price once. |
| Standard Population Deviation | The population standard deviation. | Assess weight consistency across all packages in a production batch. |
| Standard Population Deviation (Distinct) | The population standard deviation of unique values. | Measure catalog price variation; count each price once. |
| Sum | The total of the values. | Calculate each department’s total sales for the month. |
| Summary (Distinct) | The total of unique values. | Total the different service-fee amounts; count each amount once. |
| Variance | The sample variance, which measures the spread of values around their average. | Estimate invoice amount variation from a sample of invoices. |
| Variance (Distinct) | The sample variance of unique values. | Compare supplier quote variation in a sample; count each price once. |
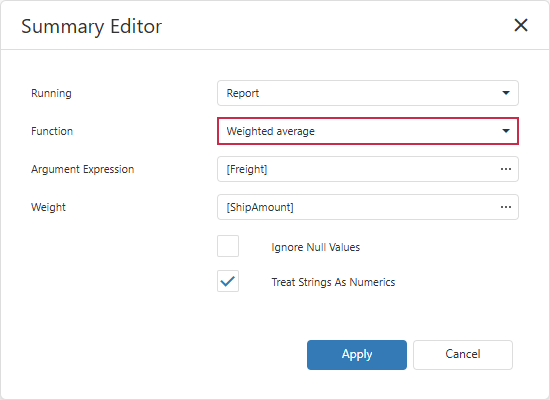
| Weighted Average | The average of values multiplied by their weights and divided by the total weight. This option is available only when you edit an existing report element. |
Calculate the average cost per item when purchases have different prices and quantities. |
Tip
Options marked (Distinct) use each unique value only once. For example, for values 10, 10, and 20, Sum returns 40, while Summary (Distinct) returns 30.
Running Totals
The Running Summary accumulates values within the selected Running scope:
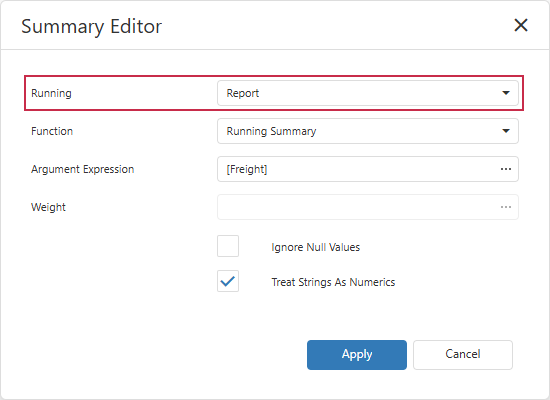
To preserve the total across group or page boundaries, select a scope that spans those boundaries:
| Running Scope | Cumulative Total Behavior |
|---|---|
| Group | Accumulates values within the current group and resets the total at the start of each group. |
| Page | Accumulates values across groups on the current page and resets the total at the start of each page. |
| Report | Accumulates values across groups and pages until the end of the report. |
For example, to display cumulative sales across all groups in the report, set Running to Report instead of Group. The total continues across all groups and pages.
Carried Forward/Brought Forward
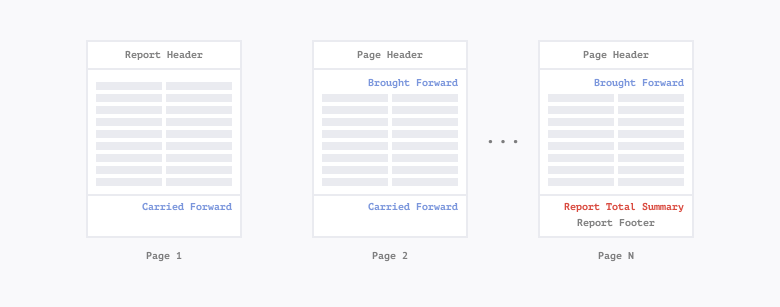
The Carryover Summary carries a cumulative total from one report page to the next. The total in a page footer is the carried-forward amount. The same total in the next page’s header is the brought-forward amount.
The following diagram illustrates how each page passes its cumulative total to the next page (the final total is displayed in the Report Footer):