Worksheet.SparklineGroups Property
Provides access to a collection of sparkline groups in a worksheet.
Namespace: DevExpress.Spreadsheet
Assembly: DevExpress.Spreadsheet.v26.1.Core.dll
Declaration
Property Value
| Type | Description |
|---|---|
| SparklineGroupCollection | A SparklineGroupCollection object that contains all the sparklines in a worksheet. |
Remarks
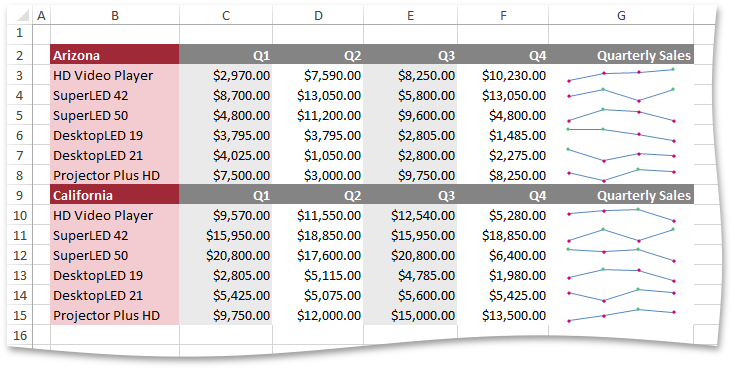
A sparkline is a tiny chart located in the background of a worksheet cell and used to visualize the data variations over time. For example, the image below shows line sparklines that demonstrate changes in quarterly sales for different states (the workbook is opened in Microsoft® Excel®).
To create a new sparkline group (containing one or more sparklines of the same type and sharing identical formatting settings), call the SparklineGroupCollection.Add method, accessible using the Worksheet.SparklineGroups.Add notation (refer to the following code snippet).
Example
Worksheet worksheet = workbook.Worksheets["SparklineExamples"];
workbook.Worksheets.ActiveWorksheet = worksheet;

// Create a group of line sparklines.
SparklineGroup quarterlyGroup = worksheet.SparklineGroups.Add(worksheet["G4:G6"], worksheet["C4:F4,C5:F5,C6:F6"], SparklineGroupType.Line);
// Add one more sparkline to the existing group.
quarterlyGroup.Sparklines.Add(6, 6, worksheet["C7:F7"]);

// Display a column sparkline in the total cell.
SparklineGroup totalGroup = worksheet.SparklineGroups.Add(worksheet["G8"], worksheet["C8:F8"], SparklineGroupType.Column);