HistogramSeriesOptions.UnderflowType Property
Returns or specifies how to create the underflow bin for a histogram chart.
Namespace: DevExpress.Spreadsheet.Charts
Assembly: DevExpress.Spreadsheet.v26.1.Core.dll
Declaration
Property Value
| Type | Description |
|---|---|
| HistogramOverflowType | An enumeration member that specifies whether to display the underflow bin and how to calculate a threshold for this bin. |
Available values:
| Name | Description |
|---|---|
| None | The chart does not include the overflow (or underflow) bin. |
| Automatic | A threshold value for the overflow (or underflow) bin is calculated automatically. |
| Fixed | The OverflowValue (or UnderflowValue) property specifies a threshold value for the overflow (or underflow) bin. |
Property Paths
You can access this nested property as listed below:
| Object Type | Path to UnderflowType |
|---|---|
| SeriesLayoutOptions |
|
Remarks
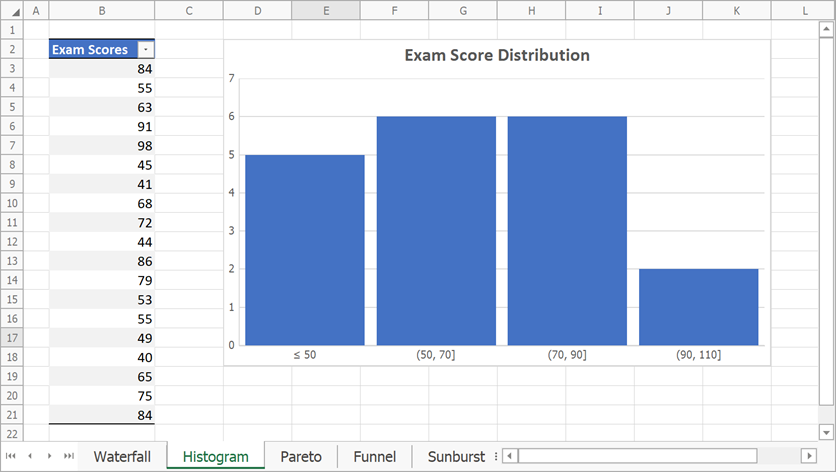
The example below demonstrates how to create a histogram chart and display the underflow bin for all points that are below or equal to a value defined by the HistogramSeriesOptions.UnderflowValue property.
// Create a histogram chart and specify its location.
Chart chart = worksheet.Charts.Add(ChartType.Histogram, worksheet["B2:B21"]);
chart.TopLeftCell = worksheet.Cells["D2"];
chart.BottomRightCell = worksheet.Cells["K18"];

// Specify histogram series options.
var options = chart.Series[0].LayoutOptions.Histogram;
options.BinType = HistogramBinType.BinWidth;
options.BinWidth = 20;
// Create the underflow bin for all values
// that are below or equal to 50.
options.UnderflowType = HistogramOverflowType.Fixed;
options.UnderflowValue = 50;

// Specify the gap width.
chart.Series[0].GapWidth = 10;

// Add the chart title.
chart.Title.Visible = true;
chart.Title.SetValue("Exam Score Distribution");