SurfaceOptions Interface
Contains formatting options for a particular surface of a 3-D chart.
Namespace: DevExpress.Spreadsheet.Charts
Assembly: DevExpress.Spreadsheet.v26.1.Core.dll
Declaration
Related API Members
The following members return SurfaceOptions objects:
Remarks
The SurfaceOptions interface provides formatting options for the three-dimensional chart side wall, back wall and floor.
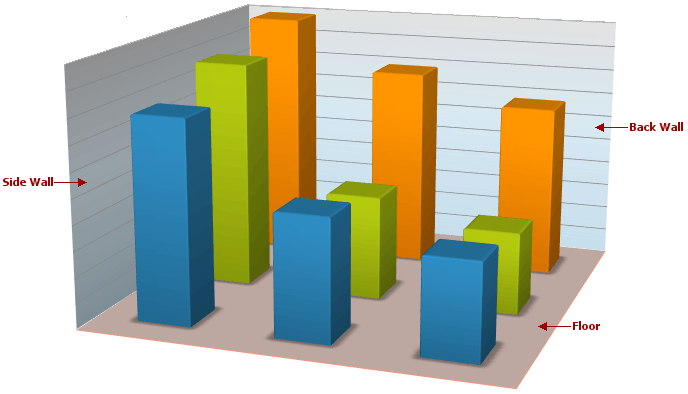
An object exposing the SurfaceOptions interface can be accessed by using the View3DOptions.SideWall, View3DOptions.BackWall or View3DOptions.Floor property, depending on the surface you wish to format. The SurfaceOptions interface allows you to define the surface filling and border line settings (via the ShapeFormatBase.Fill and ShapeFormatBase.Outline properties inherited from the ShapeFormatBase interface) and specify the surface thickness (by utilizing the SurfaceOptions.Thickness property).
Example
The example below demonstrates how to create the 3-D clustered column chart and adjust its appearance. In particular, the code specifies how to customize the chart walls and floor by using the View3DOptions.BackWall, View3DOptions.SideWall and View3DOptions.Floor properties.
Worksheet worksheet = workbook.Worksheets["chartTask5"];
workbook.Worksheets.ActiveWorksheet = worksheet;

// Create a chart and specify its location.
Chart chart = worksheet.Charts.Add(ChartType.Column3DClustered, worksheet["B2:C8"]);
chart.TopLeftCell = worksheet.Cells["F2"];
chart.BottomRightCell = worksheet.Cells["L15"];

// Specify that each data point in the series has a different color.
chart.Views[0].VaryColors = true;
// Specify the series outline.
chart.Series[0].Outline.SetSolidFill(Color.AntiqueWhite);
// Hide the legend.
chart.Legend.Visible = false;

// Specify the side wall color.
chart.View3D.SideWall.Fill.SetSolidFill(Color.FromArgb(0xDC, 0xFA, 0xDD));
// Specify the pattern fill for the back wall.
chart.View3D.BackWall.Fill.SetPatternFill(Color.FromArgb(0x9C, 0xFB, 0x9F), Color.WhiteSmoke, DevExpress.Spreadsheet.Drawings.ShapeFillPatternType.DiagonalBrick);

SurfaceOptions floorOptions = chart.View3D.Floor;
// Specify the floor color.
floorOptions.Fill.SetSolidFill(Color.FromArgb(0xFA, 0xDC, 0xF9));
// Specify the floor border.
floorOptions.Outline.SetSolidFill(Color.FromArgb(0xB4, 0x95, 0xDE));
floorOptions.Outline.Width = 1.25;