BoxAndWhiskerSeriesOptions.ShowMeanMarkers Property
Specifies whether to show the mean markers.
Namespace: DevExpress.Spreadsheet.Charts
Assembly: DevExpress.Spreadsheet.v26.1.Core.dll
Declaration
Property Value
| Type | Description |
|---|---|
| Boolean | true to display the mean markers; otherwise, false. |
Property Paths
You can access this nested property as listed below:
| Object Type | Path to ShowMeanMarkers |
|---|---|
| SeriesLayoutOptions |
|
Example
The example below demonstrates how to create a box and whisker chart and specify its options.
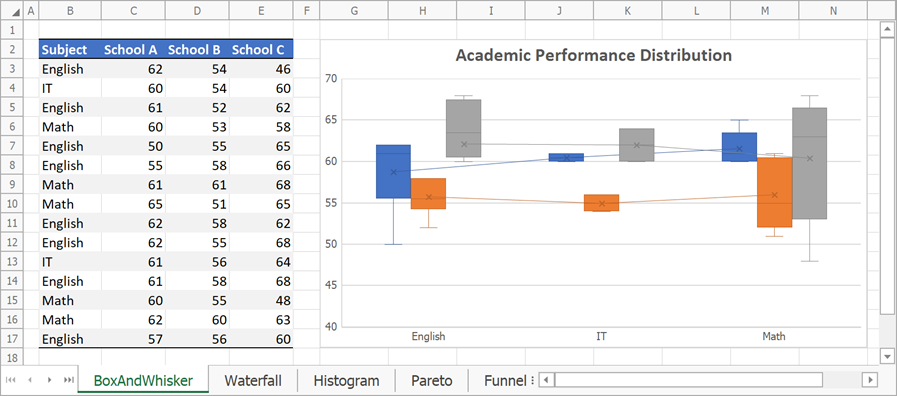
// Create a box and whisker chart and specify its location.
Chart chart = worksheet.Charts.Add(ChartType.BoxAndWhisker, worksheet["B2:E17"]);
chart.TopLeftCell = worksheet.Cells["G2"];
chart.BottomRightCell = worksheet.Cells["N17"];

// Set the minimum and maximum values for the value axis.
Axis axis = chart.PrimaryAxes[1];
axis.Scaling.AutoMax = false;
axis.Scaling.Max = 70;
axis.Scaling.AutoMin = false;
axis.Scaling.Min = 40;

// Specify series options.
foreach (Series series in chart.Series)
{
    var options = series.LayoutOptions.BoxAndWhisker;
    options.ShowMeanLine = true;
    options.ShowMeanMarkers = true;
    options.ShowInnerPoints = false;
    options.ShowOutlierPoints = false;
    options.QuartileCalculationMethod = QuartileCalculationMethod.ExclusiveMedian;
}

// Add the chart title.
chart.Title.Visible = true;
chart.Title.SetValue("Academic Performance Distribution");
See Also