WaterfallSeriesOptions.SubtotalDataPoints Property
Returns the collection of data points that are displayed as totals in a waterfall chart.
Namespace: DevExpress.Spreadsheet.Charts
Assembly: DevExpress.Spreadsheet.v26.1.Core.dll
Declaration
Property Value
| Type | Description |
|---|---|
| SubtotalDataPointCollection | A collection of ‘total’ data points in a waterfall chart. |
Property Paths
You can access this nested property as listed below:
| Object Type | Path to SubtotalDataPoints |
|---|---|
| SeriesLayoutOptions |
|
Remarks
If the source data for a waterfall chart includes subtotal and total values, you can display these values as total columns. These columns start on the horizontal axis at zero and do not float. Use the Series.LayoutOptions.Waterfall.SubtotalDataPoints.Add method to add the required data points to the total point collection.
The example below creates a waterfall chart. The third and last data points are displayed as totals.
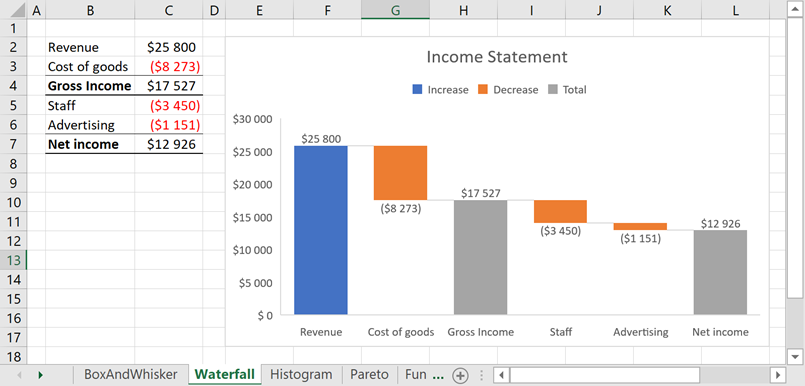
// Create a waterfall chart and specify its location.
Chart chart = worksheet.Charts.Add(ChartType.Waterfall, worksheet["B2:C7"]);
chart.TopLeftCell = worksheet.Cells["E2"];
chart.BottomRightCell = worksheet.Cells["L17"];

// Hide the major gridlines for the value axis.
chart.PrimaryAxes[1].MajorGridlines.Visible = false;

// Specify series options.
var options = chart.Series[0].LayoutOptions.Waterfall;
// Display connector lines.
options.ShowConnectorLines = true;
// Set the third data point as the total.
options.SubtotalDataPoints.Add(2);
// Set the last data point as the total.
options.SubtotalDataPoints.Add(5);

// Add the chart title.
chart.Title.Visible = true;
chart.Title.SetValue("Income Statement");
See Also