SeriesLayoutOptions.Waterfall Property
Returns options for a waterfall data series.
Namespace: DevExpress.Spreadsheet.Charts
Assembly: DevExpress.Spreadsheet.v26.1.Core.dll
Declaration
Property Value
| Type | Description |
|---|---|
| WaterfallSeriesOptions | An object that stores series options for waterfall charts. |
Property Paths
You can access this nested property as listed below:
| Object Type | Path to Waterfall |
|---|---|
| Series |
|
Remarks
Use the WaterfallSeriesOptions object’s properties to specify options for a waterfall chart.
| Property | Description |
|---|---|
| WaterfallSeriesOptions.ShowConnectorLines | Specifies whether to display connector lines between data points. |
| WaterfallSeriesOptions.SubtotalDataPoints | Returns a collection of total points. |
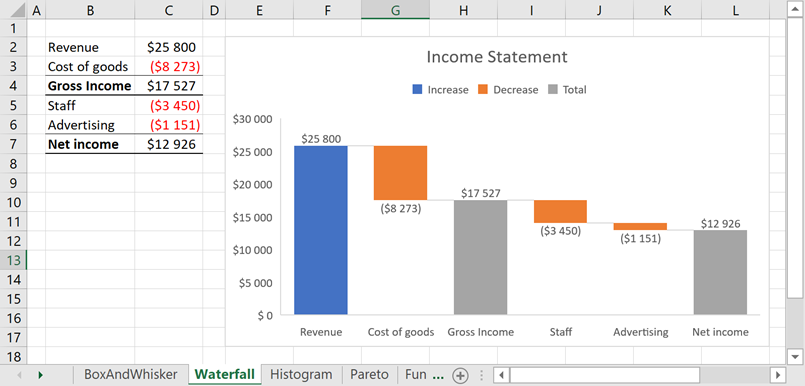
// Create a waterfall chart and specify its location.
Chart chart = worksheet.Charts.Add(ChartType.Waterfall, worksheet["B2:C7"]);
chart.TopLeftCell = worksheet.Cells["E2"];
chart.BottomRightCell = worksheet.Cells["L17"];

// Hide the major gridlines for the value axis.
chart.PrimaryAxes[1].MajorGridlines.Visible = false;

// Specify series options.
var options = chart.Series[0].LayoutOptions.Waterfall;
// Display connector lines.
options.ShowConnectorLines = true;
// Set the third data point as the total.
options.SubtotalDataPoints.Add(2);
// Set the last data point as the total.
options.SubtotalDataPoints.Add(5);

// Add the chart title.
chart.Title.Visible = true;
chart.Title.SetValue("Income Statement");
See Also