HistogramSeriesOptions Interface
Contains options for histogram and Pareto series.
Namespace: DevExpress.Spreadsheet.Charts
Assembly: DevExpress.Spreadsheet.v26.1.Core.dll
Declaration
Related API Members
The following members return HistogramSeriesOptions objects:
Remarks
Use the HistogramSeriesOptions object’s properties to specify bin options for histogram and Pareto charts.
| Property | Description |
|---|---|
| HistogramSeriesOptions.BinType | Specifies how to calculate bins for a histogram. |
| HistogramSeriesOptions.BinCount | Defines the number of histogram bins. |
| HistogramSeriesOptions.BinWidth | Defines the bin size. |
| HistogramSeriesOptions.OverflowType, HistogramSeriesOptions.OverflowValue |
Allow you to create a bin for all values that are above a specific value. |
| HistogramSeriesOptions.UnderflowType, HistogramSeriesOptions.UnderflowValue |
Allow you to create a bin for all values that are below or equal to a specific value. |
| HistogramSeriesOptions.IntervalClosedSide | Specifies the bin closed side. |
Create a Histogram Chart
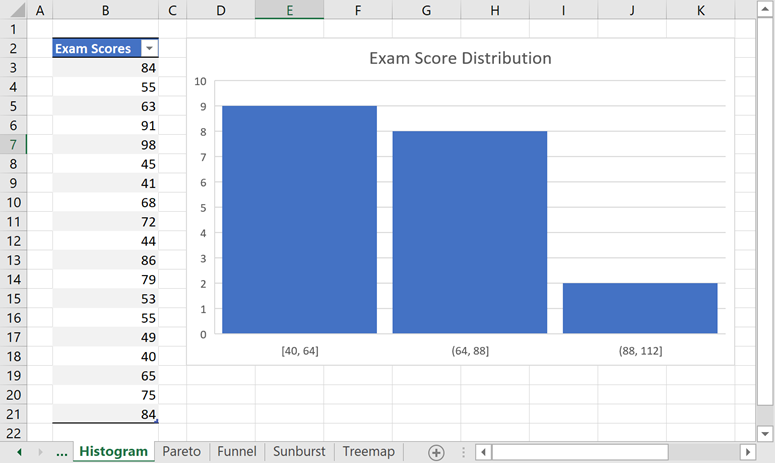
// Create a histogram chart and specify its location.
Chart chart = worksheet.Charts.Add(ChartType.Histogram, worksheet["B2:B21"]);
chart.TopLeftCell = worksheet.Cells["D2"];
chart.BottomRightCell = worksheet.Cells["K18"];

// Specify histogram series options.
var options = chart.Series[0].LayoutOptions.Histogram;
options.BinType = HistogramBinType.BinWidth;
options.BinWidth = 24;
// Specify the gap width.
chart.Series[0].GapWidth = 10;

// Add the chart title.
chart.Title.Visible = true;
chart.Title.SetValue("Exam Score Distribution");
Create a Pareto Chart

// Create a Pareto chart and specify its location.
Chart chart = worksheet.Charts.Add(ChartType.Pareto, worksheet["B2:C7"]);
chart.TopLeftCell = worksheet.Cells["E2"];
chart.BottomRightCell = worksheet.Cells["L17"];

// Specify series options.
var options = chart.Series[0].LayoutOptions.Histogram;
options.BinType = HistogramBinType.ByCategory;
// Specify the gap width.
chart.Series[0].GapWidth = 15;

// Add the chart title.
chart.Title.Visible = true;
chart.Title.SetValue("Key Causes of Late Projects");
See Also