DataTableOptions Interface
Contains display options for the chart data table.
Namespace: DevExpress.Spreadsheet.Charts
Assembly: DevExpress.Spreadsheet.v26.1.Core.dll
Declaration
Related API Members
The following members return DataTableOptions objects:
Remarks
Data tables are located at the bottom of a chart and display values that are plotted on the chart in a grid.
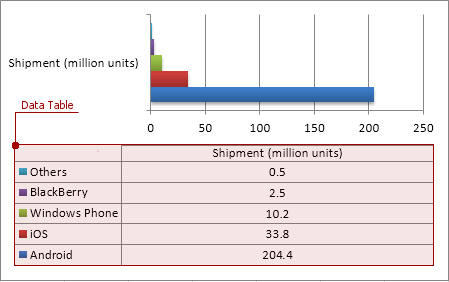
Data tables contain as many rows as there are series in a chart. Data tables are available for the following chart types:
- Column
- Bar
- Line
- Area
Note
SpreadsheetControl does not display 3D effects in chart data tables.
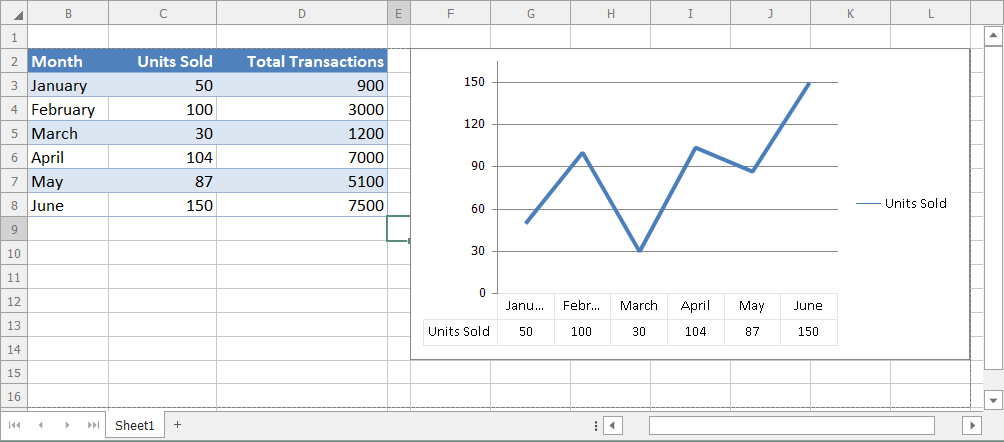
Example
The following code snippet creates a line chart and displays the data table:
using DevExpress.Spreadsheet;
using DevExpress.Spreadsheet.Charts;
//...

Worksheet worksheet = workbook.Worksheets["chartTask5"];

// Create a chart and specify its location
Chart chart = worksheet.Charts.Add(ChartType.Line, worksheet["B2:C8"]);
chart.TopLeftCell = worksheet.Cells["F2"];
chart.BottomRightCell = worksheet.Cells["L14"];

// Display a data table
// and hide legend keys
DataTableOptions dataTableOptions = chart.DataTable;
dataTableOptions.Visible = true;
dataTableOptions.ShowLegendKeys = false;
See Also