How to: Enable Automatic Scale Breaks for an Axis
- 2 minutes to read
This tutorial demonstrates how an axis range can be automatically split by scale breaks, if the chart’s data suggests their use. To learn about an alternative approach - manual scale breaks creation, refer to How to: Manually Insert a Scale Break into an Axis or How to: Manually Insert a Scale Break into an Axis (Runtime Sample).
With XtraCharts, you can allow your chart to automatically split an axis range by scale breaks, when they are required. Note that both auto-created and manual scale breaks on an axis can co-exist, without affecting the chart’s output, in cases where their ranges interfere.
To enable automatic scale breaks at design time, select the required axis, expand its Axis.AutoScaleBreaks property, and set the AutoScaleBreaks.Enabled property to true.
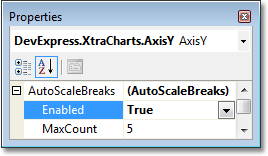
To define the maximum number for automatic scale breaks, use the AutoScaleBreaks.MaxCount property.
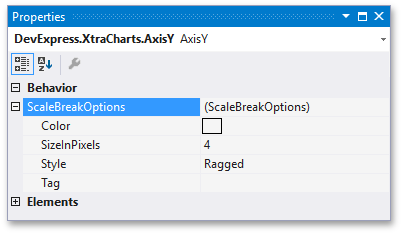
In addition, you can use the Axis.ScaleBreakOptions property, to adjust the common appearance of both manual and auto-created scale breaks.
Use the following code, to enable automatic scale breaks at runtime.
// Cast your diagram object to an appropriate diagram type,
// to access its axes.
XYDiagram diagram = (XYDiagram)chartControl1.Diagram;

// Enable automatic scale breaks creation,
// and define their maximum number.
diagram.AxisY.AutoScaleBreaks.Enabled = true;
diagram.AxisY.AutoScaleBreaks.MaxCount = 5;

// Define the scale breaks' options, which are common
// for both manual and automatic scale breaks.
diagram.AxisY.ScaleBreakOptions.Style = ScaleBreakStyle.Waved;
diagram.AxisY.ScaleBreakOptions.SizeInPixels = 30;
diagram.AxisY.ScaleBreakOptions.Color = Color.Turquoise;
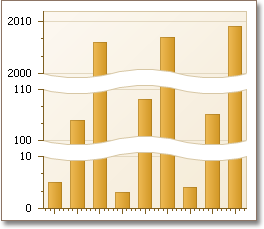
A hypothetical result is shown in the following image.