How to: Create Custom Legend Radio Buttons to Control Visibility of a Chart Series
- 4 minutes to read
This example demonstrates how to show chart series (Point, Line, or Area) depending on the selection state of a custom radio button in the chart legend.
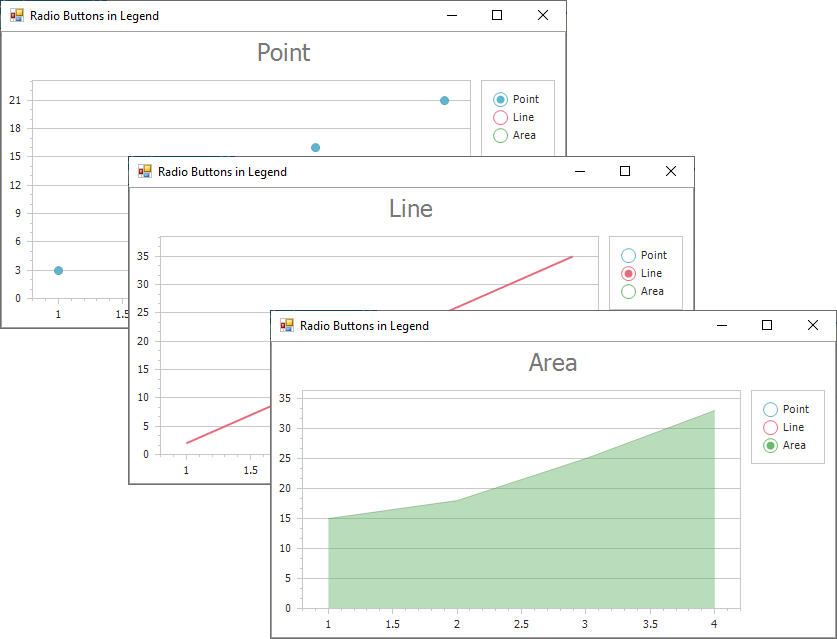
Use the ChartControl.CustomDrawSeries event handler to create a custom appearance for radio buttons based on the color of a selected series. Handle the ChartControl.LegendItemChecked event and use e.CheckedElement and SeriesBase.CheckedInLegend proeprties to show (or hide) the chart series when you switch between radio buttons.
using DevExpress.Drawing;
using DevExpress.XtraCharts;
using System;
using System.Drawing;
using System.Windows.Forms;

namespace CustomCheckboxesInLegendViewAndBehavior {
    public partial class mainForm : Form {
        const int LegendRadioSide = 17;
        const int LegendRadioInnerPointBoundsSide = 8;
        const float LegendRadioWidth = 1.5f;
        bool initializationFlag = false;

        public mainForm() {
            InitializeComponent();
            chartControl.BeginInit(); {
                chartControl.LegendItemChecked += OnLegendItemChecked;
                chartControl.CustomDrawSeries += OnCustomDrawSeries;
                chartControl.Legend.UseCheckBoxes = true;
                chartControl.Series["Point"].CheckedInLegend = false;
                chartControl.Series["Line"].CheckedInLegend = true;
                chartControl.Series["Area"].CheckedInLegend = false;
            }
            chartControl.EndInit();
            initializationFlag = false;
        }

        void OnLegendItemChecked(object sender, LegendItemCheckedEventArgs e) {
            if (initializationFlag == true)
                return;
            initializationFlag = true; {
                Series checkedSeries = e.CheckedElement as Series;
                if (checkedSeries == null)
                    throw new Exception("Expected series only");
                foreach (Series series in chartControl.Series)
                    series.CheckedInLegend = false;
                checkedSeries.CheckedInLegend = true;
                chartControl.Titles[0].Text = checkedSeries.Name;
            }
            initializationFlag = false;
        }

        void OnCustomDrawSeries(object sender, CustomDrawSeriesEventArgs e) {
            DXBitmap bitmap = new DXBitmap(LegendRadioSide, LegendRadioSide);
            using (DXGraphics graphics = DXGraphics.FromImage(bitmap)) {
                graphics.SmoothingMode = DXSmoothingMode.HighQuality;
                Color seriesColor = GetSeriesColor(e.Series, chartControl);
                using (DXPen radioPen = new DXPen(seriesColor, LegendRadioWidth)) {
                    int radioRadius = LegendRadioSide - 3;
                    Rectangle radioRectangle = new Rectangle(1, 1, radioRadius, radioRadius);
                    graphics.DrawEllipse(radioPen, radioRectangle);
                }
                if (e.Series.CheckedInLegend) {
                    using (DXBrush brush = new DXSolidBrush(seriesColor)) {
                        int coord = (LegendRadioSide - LegendRadioInnerPointBoundsSide) / 2;
                        Rectangle filledEllipseBounds = new Rectangle(coord, coord,
                              LegendRadioInnerPointBoundsSide, LegendRadioInnerPointBoundsSide);
                        graphics.FillEllipse(brush, filledEllipseBounds);
                    }
                }
            }
            e.DisposeLegendMarkerImage = true;
            e.DXLegendMarkerImage = bitmap;
        }

        Color GetSeriesColor(Series series, ChartControl chartControl) {
            int seriesIndex = chartControl.Series.IndexOf(series);
            string paletteName = chartControl.PaletteName;
            Palette currentPalette = chartControl.PaletteRepository[paletteName];
            PaletteEntry paletteEntryAccordingToSeries = currentPalette[seriesIndex];
            Color result = paletteEntryAccordingToSeries.Color;
            return result;
        }
    }
}