How to: Add a Constant Line to an Axis
- 3 minutes to read
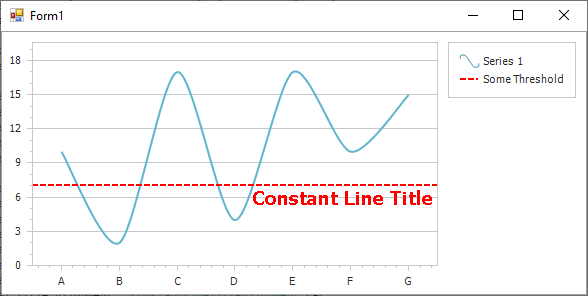
This example demonstrates how to create and customize a constant line at runtime.
Since constant lines belong to a diagram’s axis, you need to cast your diagram object to the appropriate diagram’s type. After that, you can access axes and manage their constant lines collection.
using System;
using System.Drawing;
using System.Windows.Forms;
using DevExpress.Drawing;
using DevExpress.XtraCharts;

namespace ConstLines {
    public partial class Form1 : Form {
        public Form1() {
            InitializeComponent();
        }
        private void Form1_Load(object sender, EventArgs e) {
            // Create an empty chart.
            ChartControl chartControl1 = new ChartControl();

            // Create a bar series and add points to it.
            Series series1 = new Series("Series 1", ViewType.Spline);
            series1.Points.Add(new SeriesPoint("A", new double[] { 10 }));
            series1.Points.Add(new SeriesPoint("B", new double[] { 2 }));
            series1.Points.Add(new SeriesPoint("C", new double[] { 17 }));
            series1.Points.Add(new SeriesPoint("D", new double[] { 4 }));
            series1.Points.Add(new SeriesPoint("E", new double[] { 17 }));
            series1.Points.Add(new SeriesPoint("F", new double[] { 10 }));
            series1.Points.Add(new SeriesPoint("G", new double[] { 15 }));

            // Add the series to the chart.
            chartControl1.Series.Add(series1);

            // Cast the chart's diagram to the XYDiagram type, to access its axes.
            XYDiagram diagram = chartControl1.Diagram as XYDiagram;

            // Create a constant line.
            ConstantLine constantLine1 = new ConstantLine("Constant Line 1");
            diagram.AxisY.ConstantLines.Add(constantLine1);

            // Define its axis value.
            constantLine1.AxisValue = 7;

            // Customize the behavior of the constant line.
            constantLine1.Visible = true;
            constantLine1.ShowInLegend = true;
            constantLine1.LegendText = "Some Threshold";
            constantLine1.ShowBehind = false;

            // Customize the constant line's title.
            constantLine1.Title.Visible = true;
            constantLine1.Title.Text = "Constant Line Title";
            constantLine1.Title.TextColor = Color.Red;
            constantLine1.Title.EnableAntialiasing = DevExpress.Utils.DefaultBoolean.False;
            constantLine1.Title.DXFont = new DXFont("Tahoma", 14, DXFontStyle.Bold);
            constantLine1.Title.ShowBelowLine = true;
            constantLine1.Title.Alignment = ConstantLineTitleAlignment.Far;

            // Customize the appearance of the constant line.
            constantLine1.Color = Color.Red;
            constantLine1.LineStyle.DashStyle = DashStyle.Dash;
            constantLine1.LineStyle.Thickness = 2;

            // Add the chart to the form.
            chartControl1.Dock = DockStyle.Fill;
            this.Controls.Add(chartControl1);
        }
    }
}
See Also