How to: Show a Regression Line for a Stock Chart
This tutorial demonstrates how linear regression analysis can be applied to a chart’s visual data at design time. For general information, see Regression Lines.
To show a Regression Line for a Stock chart follow the steps below.
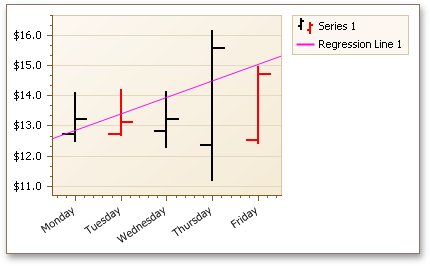
Create a new or open an existing Stock chart. For this example we will use the following chart.

Select the series in the Property Grid, expand its SeriesBase.View property and click the ellipsis button for the XYDiagram2DSeriesViewBase.Indicators property.
In the invoked Indicators dialog, click the Add… button.

Then, in the Indicator Type dialog, choose Regression Line and click OK.

Now, back in the Indicators dialog, you can specify the Regression Line’s SingleLevelIndicator.ValueLevel and other options.

The result is shown in the following image.

Note that as with other indicators, all Regression Lines that exist in a chart are painted based on the palette defined via the ChartControl.IndicatorsPaletteName property.