How to: Create a 2D Spline Chart
- 4 minutes to read
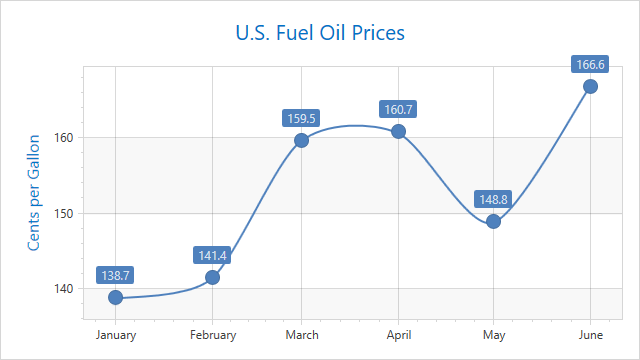
This example demonstrates how to create a 2D Spline chart.
Create a ChartControl and specify its ChartControl.Diagram property to a SimpleDiagram2D object.
Note
Note that the ChartControl.Diagram is a content property. You can declare a diagram in XAML directly after a chart control’s declaration without wrapping it in opening and closing ChartControl.Diagram tags.
Add a SplineSeries2D object to the Diagram.Series collection.
Note
Note that the Diagram.Series is a content property. You can declare series in XAML directly after a diagram’s declaration without wrapping them in opening and closing Diagram.Series tags.
Use the following properties to bind the series to data:
- Series.DataSource - Specifies the series’s data source.
- Series.ArgumentDataMember - Defines the data member that provides the series’s arguments.
- Series.ValueDataMember - Specifies the data member that provides the series’s values.
To enable series markers, use the LineSeries2D.MarkerVisible property. The LineSeries2D.MarkerSize property allows you to set the marker size.
Assign a SeriesLabel object to the Series.Label property. Use the following properties to customize series label options:
- MarkerSeries2D.Angle - Gets or sets the angle which controls the position of series point labels for all 2D series with markers (e.g. Line, Point, etc.).
- SeriesLabel.ConnectorVisible - Gets or sets the visibility of a connector line from the series point label to the series point marker.
- SeriesLabel.Indent - Gets or sets the distance between a series point and its series label.
- SeriesLabel.ResolveOverlappingMode - Gets or sets a value specifying the mode to resolve overlapping of series labels.
- Series.LabelsVisibility - Specifies whether to show series labels.
Use the properties below to customize axes:
- AxisBase.GridLinesVisible - Specifies whether to show axis grid lines.
- AxisLabel.TextPattern - Gets or sets a format string that specifies the text to be displayed within the axis label.
- TitleBase.Content - Gets or sets the title’s content. This is a dependency property.
- AxisY2D.AlwaysShowZeroLevel - Gets or sets a value that specifies whether to show the zero level of the AxisY2D.
<Window
        xmlns="http://schemas.microsoft.com/winfx/2006/xaml/presentation"
        xmlns:x="http://schemas.microsoft.com/winfx/2006/xaml"
        xmlns:dxc="http://schemas.devexpress.com/winfx/2008/xaml/charts"
        x:Class="SplineChart.MainWindow"
        xmlns:local="clr-namespace:SplineChart"
        Title="Spline Chart" Height="440" Width="660">
    <Window.DataContext>
        <local:ChartViewModel/>
    </Window.DataContext>
    <Grid>
        <dxc:ChartControl>
            <dxc:XYDiagram2D>
                <dxc:SplineSeries2D DataSource="{Binding Data}"
                                    ArgumentDataMember="Argument"
                                    ValueDataMember="Value"
                                    LineTension="0.8"
                                    MarkerSize="15"
                                    MarkerVisible="True">
                    <dxc:SplineSeries2D.Label>
                        <dxc:SeriesLabel dxc:MarkerSeries2D.Angle="90"
                                         ConnectorVisible="False"
                                         Indent="15"
                                         ResolveOverlappingMode="Default"
                                         Visible="True"/>
                    </dxc:SplineSeries2D.Label>
                </dxc:SplineSeries2D>
                <dxc:XYDiagram2D.AxisX>
                    <dxc:AxisX2D GridLinesVisible="True"/>
                </dxc:XYDiagram2D.AxisX>
                <dxc:XYDiagram2D.AxisY>
                    <dxc:AxisY2D>
                        <dxc:AxisY2D.Title>
                            <dxc:AxisTitle Content="Cents per Gallon"/>
                        </dxc:AxisY2D.Title>
                        <dxc:AxisY2D.WholeRange>
                            <dxc:Range dxc:AxisY2D.AlwaysShowZeroLevel="False"/>
                        </dxc:AxisY2D.WholeRange>
                    </dxc:AxisY2D>
                </dxc:XYDiagram2D.AxisY>
            </dxc:XYDiagram2D>
            <dxc:ChartControl.Titles>
                <dxc:Title Dock="Top"
                           HorizontalAlignment="Center"
                           Content="U.S. Fuel Oil Prices"/>
            </dxc:ChartControl.Titles>
        </dxc:ChartControl>
    </Grid>
</Window>