How to: Provide a Custom Template for Series Labels
The following example demonstrates how to change the appearance of series labels.
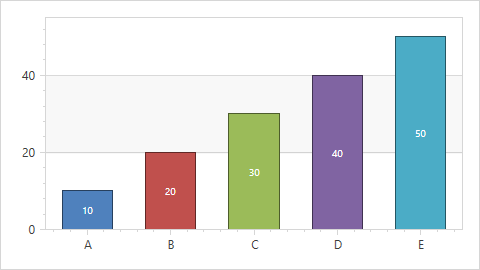
To accomplish this, it is necessary to create a DataTemplate that specifies the appearance of series labels, and add it to a window’s resource. Then, this template can be applied to a series label via its ChartTextElement.ElementTemplate property.
Note
The chart control displays a crosshair cursor instead of series labels in the diagram by default. To provide series labels customization, enable series labels (set the Series.LabelsVisibility property to true) and disable the crosshair cursor (set the ChartControlBase.CrosshairEnabled property to false).
<Window x:Class="CustomLabelTemplate.Window1"
        xmlns="http://schemas.microsoft.com/winfx/2006/xaml/presentation"
        xmlns:x="http://schemas.microsoft.com/winfx/2006/xaml"
        xmlns:dxc="http://schemas.devexpress.com/winfx/2008/xaml/charts"
        Title="Window1" Height="331" Width="488">
    <Window.Resources>
        <ResourceDictionary>
            <DataTemplate x:Key="template">
                <Border BorderThickness="1" CornerRadius="9" Opacity="1.0">
                    <Border.Background>
                        <SolidColorBrush Color="{Binding Path=Color}"/>
                    </Border.Background>
                    <Label Content="{Binding Path=Text}" Padding="5,1,5,1.5"
                           Foreground="White" FontSize="10" />
                </Border>
            </DataTemplate>
        </ResourceDictionary>
    </Window.Resources>
    <Grid>
        <dxc:ChartControl  CrosshairEnabled="False">
            <dxc:ChartControl.Diagram>
                <dxc:XYDiagram2D>
                    <dxc:XYDiagram2D.Series>
                        <dxc:BarSideBySideSeries2D LabelsVisibility="True" ColorEach="True">
                            <dxc:BarSideBySideSeries2D.Points>
                                <dxc:SeriesPoint Argument="A" Value="10" />
                                <dxc:SeriesPoint Argument="B" Value="20" />
                                <dxc:SeriesPoint Argument="C" Value="30" />
                                <dxc:SeriesPoint Argument="D" Value="40" />
                                <dxc:SeriesPoint Argument="E" Value="50" />
                            </dxc:BarSideBySideSeries2D.Points>
                            <dxc:Series.Label>
                                <dxc:SeriesLabel ConnectorVisible="False" ElementTemplate="{StaticResource template}" />
                            </dxc:Series.Label>
                        </dxc:BarSideBySideSeries2D>
                    </dxc:XYDiagram2D.Series>
                </dxc:XYDiagram2D>
            </dxc:ChartControl.Diagram>
        </dxc:ChartControl>
    </Grid>
</Window>