Conditional Formatting
- 4 minutes to read
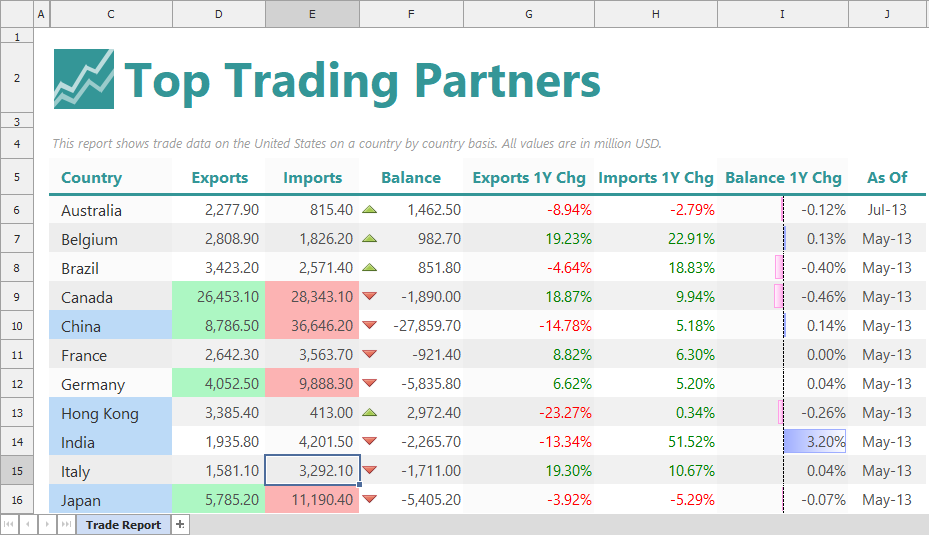
Conditional formatting allows you to apply custom formatting to cells that meet certain criteria. Rules that affect the same cell or cell range can either complement or override each other according to their priority. Conditional formatting is particularly useful for data analysis and value change tracking.
Supported Products
- Spreadsheet
- TdxSpreadSheet
- A Spreadsheet control.
- TdxSpreadSheetReportDesigner
- A data-aware Spreadsheet control for document generation (Mail Merge).
- Data Grid
- Tree List
- TcxDBTreeList
- A data-aware Tree List control.
- TcxTreeList
- A control that displays data in a tree-like manner.
- Vertical Grid
- TcxVerticalGrid
- The vertical grid control that implements single record and banded layouts.
- TcxDBVerticalGrid
- Represents the data-aware vertical grid control.
- TcxVirtualVerticalGrid
- The vertical grid control that implements single record, multi record and banded layouts.
Conditional Formatting Rules
Multiple conditional formatting rules can affect the same cells. If a cell meets formatting criteria of more than one rule, you can use Index and StopIfTrue properties of these rules to specify how they interact.
Style-Based Rules
All style-based rules apply spreadsheet-compatible style settings to the cells that meet specific formatting conditions.
Simple Condition-Based Rules
Simple condition-based rules apply custom formatting to cells whose values meet one simple condition (unique, duplicate, top, bottom, or average).
- Above or Below Average
Applies custom formatting to all affected cells whose numeric values are above, below, or equal to the calculated average.
The rule’s ComparisonOperator property allows you to select the required evaluation mode. Certain evaluation modes use the specified standard deviation multiplier.
- Duplicate Values | Unique Values
These rules allow you to apply custom formatting to duplicate and unique values.
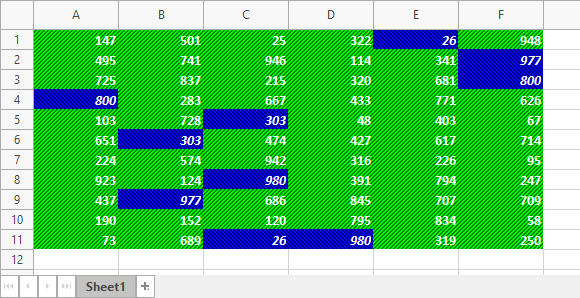
- Top/Bottom Values
Applies custom formatting to the specified absolute or relative number of affected cells that contain the highest or lowest numeric values.
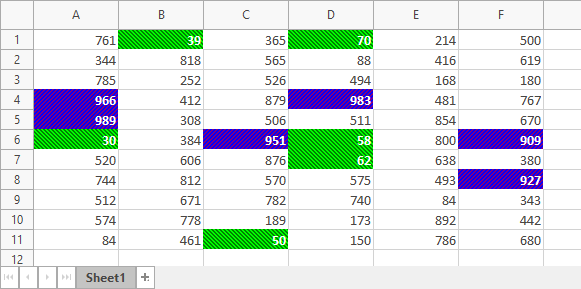
The rule’s Direction property allows you to switch between Top and Bottom formatting modes.
Expression-Based Rules
Expression-based rules evaluate cell values based on formula expressions.
In Spreadsheet and Report Designer controls, formula expressions follow the same syntax as in Microsoft Excel®, and formula operands can refer to individual cells and cell ranges.
In Data Grid, Vertical Grid, and Tree List, you can use the same built-in functions available in Spreadsheet and Report Designer controls. However, formula expressions can refer only to data items[1] rather than individual cells or arbitrary cell ranges.
To refer to a data item in a formula expression, you can use the data item’s caption enclosed in square brackets:
=[Sales]>AVERAGE([Sales],)*1.2
If you use a data-aware grid View, Vertical Grid, or Tree List control, you can also refer to the corresponding dataset field by its name enclosed in curly brackets:
={fieldSales}>AVERAGE({fieldSales},)*1.2
- Cell Is
Applies custom formatting to all affected cells whose values meet one of the following conditions depending on the ComparisonOperator property value:
Values are within or outside the range between the results of two formula expressions assigned to Expression and Expression2 properties.
Values are above, below, or equal to the result of a formula expression assigned to the Expression property.
- Expression
Applies custom formatting to all affected cells for which the calculated formula expression returns
TRUE.The rule’s Expression property specifies the formula expression used as a cell formatting criterion.
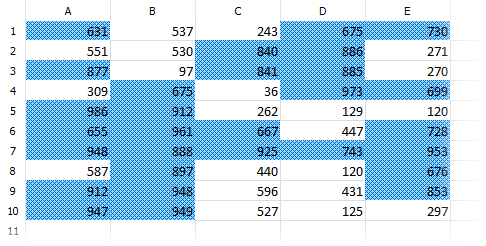
Threshold-Based Conditional Formatting Rules
Threshold-based rules use icons or simple scales to differentiate all affected cells by their numeric values.
- Data Bar
Visualizes numeric values in the affected cells as horizontal data bars. Use the rule’s Style property to customize data bar appearance settings.
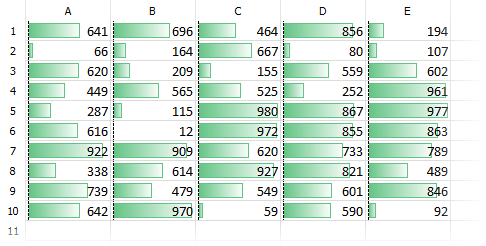
The range of displayed numeric values is limited by lowest and highest values out-of-the-box. You can use MinValue and MaxValue properties to adjust this range.
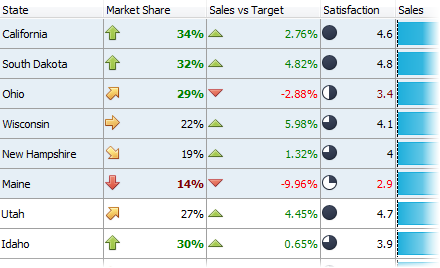
- Icon Set
Draws icons within cells whose numeric values are greater than or equal to the specified thresholds. Use the rule’s PresetName property to select a predefined icon preset that associates icons with the thresholds. The threshold count is always equal to the number of icons in the selected preset.
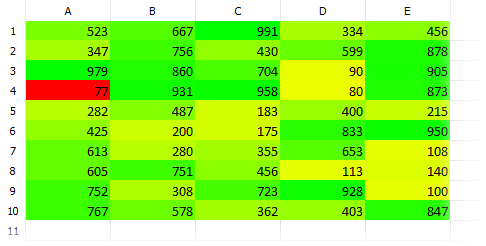
- Three Color Scale
Fills backgrounds of affected cells with colors of a calculated gradient. The gradient has three key point colors that correspond to lowest, intermediate, and highest threshold values.
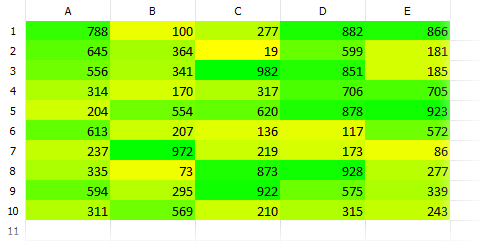
- Two Color Scale
Fills backgrounds of affected cells with colors of a calculated gradient. The gradient has two key point colors that correspond to lowest and highest threshold values.
-
A data item corresponds to an individual field of the underlying dataset. Different container controls display data items in a different manner:
- A Vertical Grid control displays data items as rows.
- A Data Grid control’s Table and Banded Table Views display table items as columns. Data items correspond to other visual elements in other grid Views.
- A Tree List control displays data items as columns.