How to: Individually Customize Axis Labels
- 2 minutes to read
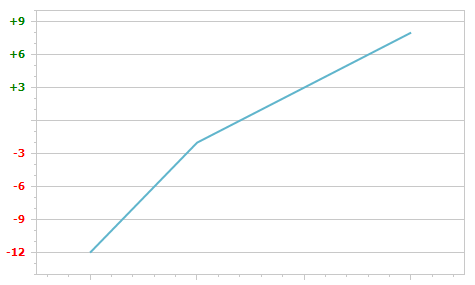
Apart from the capability to customize the overall appearance of axis labels, you can obtain individual axis labels at runtime. Then, it’s possible to apply all the options available for axis labels to them, individually. You can apply different formatting to axis labels based on some criteria (for example, an axis value threshold).
For this, the special ChartControl.CustomDrawAxisLabel event is introduced. Handle it to obtain axis labels.
Note
For the WebChartControl you should handle its WebChartControl.CustomDrawAxisLabel event to implement this task.
The following code demonstrates one possible implementation of this capability.
private void chartControl1_CustomDrawAxisLabel(object sender, CustomDrawAxisLabelEventArgs e) {
    AxisBase axis = e.Item.Axis;
    if (axis is AxisY || axis is AxisY3D || axis is RadarAxisY) {
        double axisValue = (double)e.Item.AxisValue;
        if (axisValue < 0)
            // Customize the axis label's color.
            e.Item.TextColor = Color.Red;
        else if (axisValue > 0) {
            // Customize the axis label's text and color.
            e.Item.Text = "+" + e.Item.Text;
            e.Item.TextColor = Color.Green;
        }
        else if (axisValue == 0) {
            // Hide the axis labels.
            e.Item.Text = "";
        }
    }
}
The following image shows the resulting Chart:

See Also