How to: Add a Chart to a Windows Forms Application
- 2 minutes to read
The following example adds the ChartControl to a form. Note that the Chart Control can be added to your charting application at both design time and runtime.
Design Time
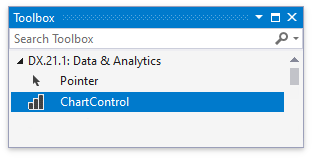
The ChartControl item is added to the DX.26.1: Data & Analytics toolbox tab of the VS IDE. To add the Chart Control to your project, simply drag the corresponding toolbox item and drop it onto the form.
Note
While adding the ChartControl, the Chart Wizard window may be invoked (in case its “Show wizard every time a new chart is added” option is enabled). Click Cancel if you do not want to use it, or go through its steps to customize the initial look of your chart.
Tip
If the Toolbox does not contain the ChartControl, refer to the following troubleshooting help topic: Troubleshoot Toolbox Items in Visual Studio - DevExpress Unified Component Installer.
Runtime
To add a Chart Control to a form at runtime, make sure to include all necessary assemblies to the References list of your project.
using System.Drawing;
using System.Windows.Forms;
using DevExpress.XtraCharts;
// ...

private void OnButtonClick(object sender, System.EventArgs e) {
    // Create a new Chart control.
    ChartControl chart = new ChartControl();

    // Set the chart's location.
    chart.Location = new Point(10, 10);

    // Perform any other initialization here.
    // ...
    // ...

    // Add the chart to the Form.
    this.Controls.AddRange(new Control[] {chart});
}