Animate Series
- 2 minutes to read
This topic provides information on how to animate series for both 2D and 3D chart types.
2D Animated Charts
In the 2D chart types, there are two approaches to providing an animation effect for the series:
- all series can be animated simultaneously using the built-in animation effect;
- the animation effect can be specified for each series individually.
To animate all series and/or series points within a chart using the built-in animation effect (depends on a given series type), specify the chart animation mode using the ChartControl.AnimationMode property.
Note
To obtain the list of all animations that are available for a given series, use the Series.GetPredefinedSeriesAnimationKinds and Series.GetPredefinedPointAnimationKinds methods.
To animate a specific series using a custom effect, assign an animation to its SeriesAnimation property (e.g., AreaSeries2D.SeriesAnimation).
The following is a list of animation effects that are available for the AreaSeries2D view type:
- Area2DDropFromFarAnimation
- Area2DDropFromNearAnimation
- Area2DGrowUpAnimation
- Area2DStretchFromFarAnimation
- Area2DStretchFromNearAnimation
- Area2DStretchOutAnimation
- Area2DUnwindAnimation
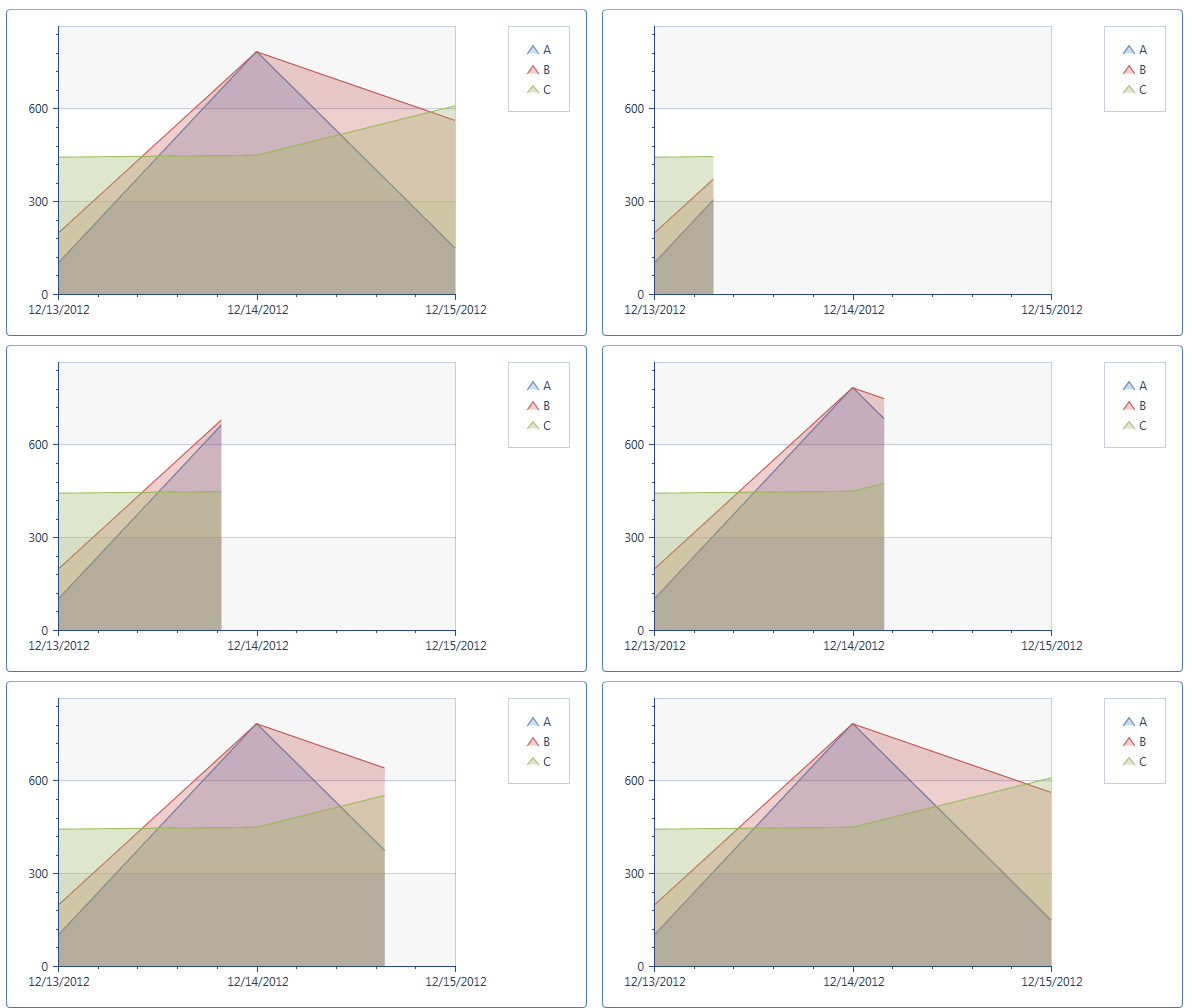
The image below shows the Area2DUnwindAnimation effect in action.

Example
For a real-world example on how to animate a chart series, see the following tutorial.
To customize the animation effect, you can use the following properties.
| Member | Description |
|---|---|
| Series.AnimationAutoStartMode | Specifies the automatic start mode for the animation. This is a dependency property. |
| AnimationBase.BeginTime | Specifies the time when the animation is started. This is a dependency property. |
| AnimationBase.Duration | Specifies the duration of the animation. This is a dependency property. |
| AnimationBase.EasingFunction | Specifies the easing function for the animation. This is a dependency property. |
3D Animated Charts
To animate a series of the 3D chart type, add a trigger to a series Triggers collection, which will start the series animation in response to the chart’s Loaded event.
The following image shows the BarSideBySideSeries3D chart type animation.

Example
For a real-world example on how this can be done, see the following tutorial.