Value Indicators
- 2 minutes to read
This document gives the definition of a value indicator and also explains what types of value indicators exist and how they should be used in a Gauge control.
A Value Indicator is a dynamic gauge element that is used to track the changing of a data value or a data range on a scale. This value can be accessible via the ValueIndicatorBase.Value property of the ValueIndicatorBase class.
Note
The ValueIndicatorBase.Value property of the value indicator can be changed not only programmatically, but also by end-users via mouse-clicks. This capability becomes available after setting the ValueIndicatorBase.IsInteractive property to true.
Depending on the type of a Scale, various kinds of value indicators can be used with it.
Arc Scale’s Indicators
The following value indicators are appropriate for the Arc Scale.
| Element | Description | Class | Collection | Accessibilty |
|---|---|---|---|---|
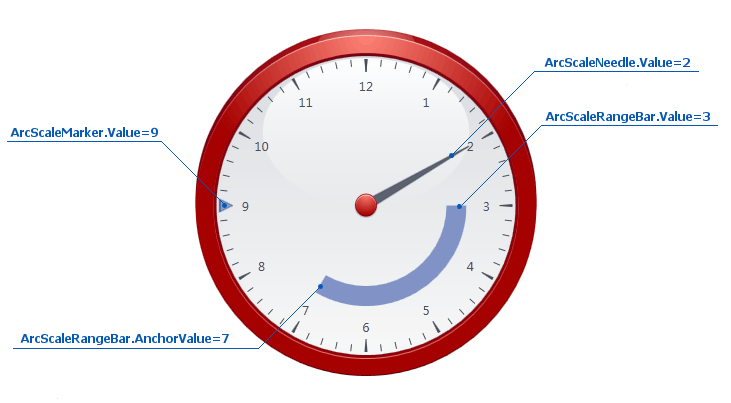
| Needle | A needle-like element that is used to indicate a current value in a Circular Gauge. | ArcScaleNeedle | ArcScaleNeedleCollection | ArcScale.Needles |
| Marker | A Marker is a small pointer that indicates a fixed value. | ArcScaleMarker | ArcScaleMarkerCollection | ArcScale.Markers |
| Range Bar | A Range Bar is a filled sector that represents a specific interval (e.g. working hours). | ArcScaleRangeBar | ArcScaleRangeBarCollection | ArcScale.RangeBars |
Value indicators for the circular scale are shown in the image below:

Linear Scale’s Indicators
In the Linear Scale three types of value indicators are available.
| Element | Description | Class | Collection | Accessibilty |
|---|---|---|---|---|
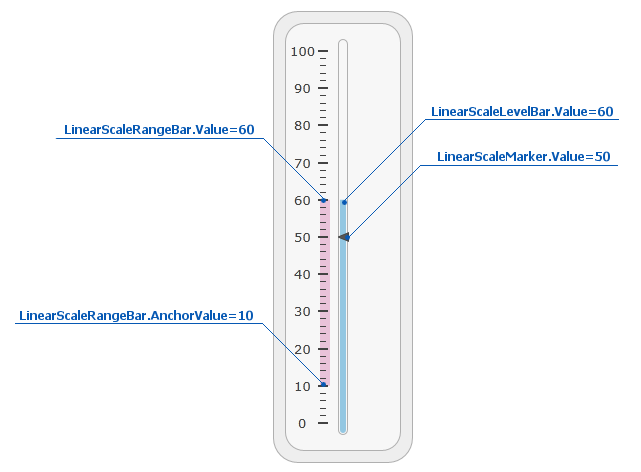
| Level Bar | A Level Bar performs the same function as a conventional thermometer (e.g. the current temperature). | LinearScaleLevelBar | LinearScaleLevelBarCollection | LinearScale.LevelBars |
| Marker | A Marker is a scale pointer that indicates a certain value along a scale (e.g. an average temperature in a thermometer). | LinearScaleMarker | LinearScaleMarkerCollection | LinearScale.Markers |
| Range Bar | A Range Bar is a filled rectangle that represents some data range along a scale. | LinearScaleRangeBar | LinearScaleRangeBarCollection | LinearScale.RangeBars |
Value indicators for linear scale are illustrated in the image below.
