Accessibility in Blazor Charts
- 6 minutes to read
DevExpress Blazor Charts allow you to configure visual cues and interaction options to improve chart accessibility. These settings help users perceive, understand, and navigate chart content.
This topic lists techniques that help your charts align with WCAG criteria for Use of Color, Non-text Contrast, and Dragging Movements.
Use of Color
The Use of Color criterion requires visual cues other than color, such as shapes or text, to convey meaning. Charts rely on visual presentation to convey information, so configure your chart to meet this criterion using the following techniques:
- Apply a different dash style to each line-based series, crosshair, and constant line.
- Customize point size, symbol, and image in area-, line-, and scatter-based series. You can declare a DxChartSeriesPoint within a series or handle the CustomizeSeriesPoint event to apply customizations.
- Configure series labels to display arguments/categories and values. We recommend that you display both, as this meets the Non-text Contrast criterion. If you display only values, add a label connector to help users understand slice proportions.
- Use annotations (DxChartAnnotation/DxPieChartAnnotation) to mark outliers, thresholds, events, or other important data directly on the chart plane. An annotation that explains meaningful categories or states supplies a visible text cue independent of color.
- Use chart titles and subtitles to explain chart-wide information.
- Supplemental. Add a legend to help users locate the series on a plane by its legend item and name using hover.
- Supplemental. Display a tooltip that contains information about series name, arguments, and values.
Supplemental. Consider adding the main takeaways as text, as this satisfies the Non-text Content criterion without relying on visual presentation. This technique is useful in the following cases:
- Dense charts with overlapping labels
- Pie Charts with many sectors
- Area and bar series (since fill patterns are unavailable in Blazor Charts)
- Data that users might want to compare precisely
Non-Text Contrast
You can use the following techniques to meet the Non-text Contrast criterion:
- Configure series labels to display arguments/categories and values.
Use a custom high-contrast palette. You can create your own palette based on specific user needs or use the following set of colors:
#228833,#ccbb44,#ee6677,#aa3377,#4477aa,#66ccee,#bbbbbb.If your chart contains many series or pie slices, use the
AlternateorBlendpalette extension mode.The following image illustrates the use of the suggested high-contrast palette. The available palette colors appear on the right, and the Pie Chart that uses this palette with the
Blendextension mode appears on the left:
<DxPieChart Data="@GetData()"
            Width="400"
            InnerDiameter="0.5"
            Palette="@(new string[] { "#228833", "#ccbb44", "#ee6677", "#aa3377", "#4477aa", "#66ccee", "#bbbbbb" })"
            PaletteExtensionMode="ChartPaletteExtensionMode.Blend">
    <DxChartLegend Visible="false"/>
    <DxPieChartSeries ArgumentField="@((DataPoint s) => s.Argument)"
                    ValueField="@((DataPoint s) => s.Value)"/>
</DxPieChart>
Dragging Movements
<DxChart> supports the following zoom and pan operations:
- Zoom in / out (mouse wheel, zoom/pinch gestures)
- Zoom in to a specific area (select a rectangle with the mouse)
- Pan (mouse and scrollbar, swipe gestures)
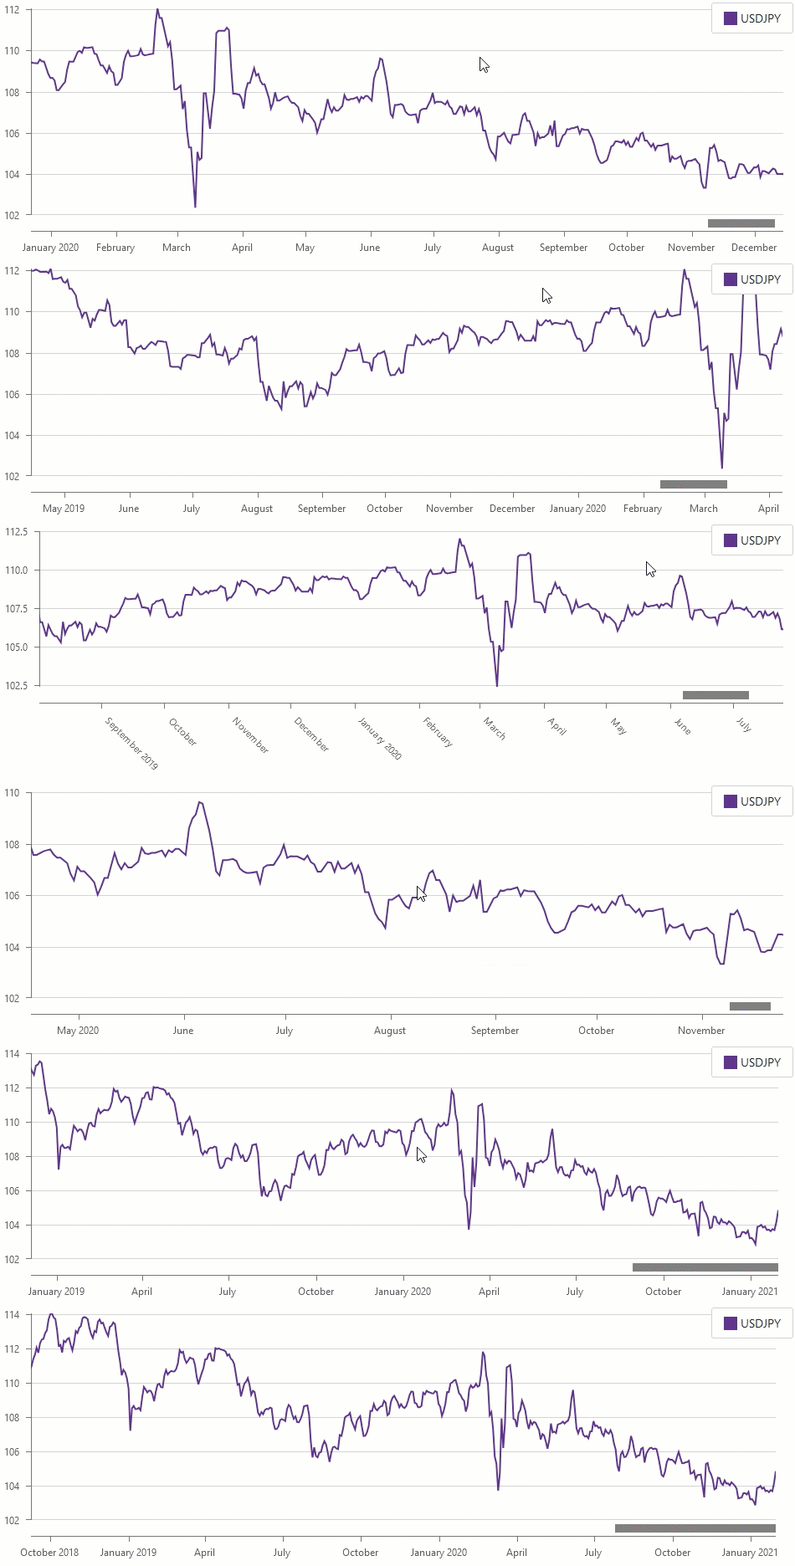
You can introduce accessibility-friendly zoom and pan operations (that conform to the Dragging Movements criteria) using built-in visual range API:
- Create a Chart and populate it with data.
- Enable zoom and pan operations. Display a scroll bar if needed.
- Add a DxToolbar that contains Pan Left, Pan Right, Zoom In, and Zoom Out commands.
- Add a DxChartAxisRange object to adjust the visual range after a user clicks toolbar buttons.
- Implement visual range shift for each operation (review a sample implementation below).
<DxToolbar CssClass="w-100 chart-toolbar" ItemRenderStyleMode="ToolbarRenderStyleMode.Plain">
    <DxToolbarItem Alignment="ToolbarItemAlignment.Right"
                   IconCssClass="chart-icon chart-icon-caret-left"
                   Click="@PanLeft"
                   Tooltip="Pan Left" />
    <DxToolbarItem Alignment="ToolbarItemAlignment.Right"
                   IconCssClass="chart-icon chart-icon-caret-right"
                   Click="@PanRight"
                   Tooltip="Pan Right" />
    <DxToolbarItem BeginGroup="true"
                   Alignment="ToolbarItemAlignment.Right"
                   IconCssClass="chart-icon chart-icon-zoom-in"
                   Click="@ZoomIn"
                   Tooltip="Zoom In" />
    <DxToolbarItem Alignment="ToolbarItemAlignment.Right"
                   IconCssClass="chart-icon chart-icon-zoom-out"
                   Click="@ZoomOut"
                   Tooltip="Zoom Out" />
    <DxToolbarItem Alignment="ToolbarItemAlignment.Right"
                   IconCssClass="chart-icon chart-icon-arrow-reset"
                   Click="@ResetZoom"
                   Tooltip="Reset Zoom" />
</DxToolbar>

<DxChart @ref="@chart"
         T="DatePricePoint"
         Data="@UsdJpyData"
         VisualRangeChanged="@OnVisualRangeChanged"
         Width="100%">

    <DxChartLegend Position="RelativePosition.Inside"
                   VerticalAlignment="VerticalEdge.Top"
                   HorizontalAlignment="HorizontalAlignment.Right" />

    <DxChartLineSeries T="DatePricePoint"
                       TArgument="DateTime"
                       TValue="double"
                       ArgumentField="i => i.DateTimeStamp"
                       ValueField="i => i.Price"
                       Name="USDJPY">
        <DxChartSeriesPoint Visible="false" />
        <DxChartAggregationSettings Enabled="true"
                                    Method="ChartAggregationMethod.Average" />
    </DxChartLineSeries>

    <DxChartArgumentAxis>
        <DxChartAxisRange StartValue="startDate"
                          EndValue="endDate" />
    </DxChartArgumentAxis>

    <DxChartZoomAndPanSettings ArgumentAxisZoomAndPanMode="ChartAxisZoomAndPanMode.Both" />

    <DxChartScrollBarSettings ArgumentAxisScrollBarVisible="true"
                              ArgumentAxisScrollBarPosition="ChartScrollBarPosition.Bottom" />
@* ... *@
</DxChart>
@* ... *@
@code {
    const double PanStepFraction = 0.25;
    const double ZoomFactor = 0.75;
    const int MinVisibleSpanDays = 7;

    IEnumerable<DatePricePoint> UsdJpyData;
    DxChart<DatePricePoint> chart;
    @inject ICurrencyExchangeDataProvider UsdJpyDataProvider

    readonly DateTime startDate = new DateTime(2020, 01, 01);
    readonly DateTime endDate = new DateTime(2021, 01, 29);

    DateTime dataMinDate;
    DateTime dataMaxDate;
    DateTime currentVisualStart;
    DateTime currentVisualEnd;

    async void ExportChart(ChartExportFormat format) {
        await chart?.ExportAsync("ZoomAndPanChart", format);
    }

    protected override async Task OnInitializedAsync() {
        UsdJpyData = await UsdJpyDataProvider.GetDataAsync();
        currentVisualStart = startDate;
        currentVisualEnd = endDate;

        var dataPoints = UsdJpyData as IList<DatePricePoint> ?? UsdJpyData.ToList();
        if (dataPoints.Count > 0) {
            dataMinDate = dataPoints.Min(d => d.DateTimeStamp);
            dataMaxDate = dataPoints.Max(d => d.DateTimeStamp);
        }
        else {
            dataMinDate = startDate;
            dataMaxDate = endDate;
        }
    }

    void OnVisualRangeChanged(ChartVisualRangeChangedEventArgs args) {
        if (args.IsArgumentAxis && args.CurrentRange is { Count: 2 }) {
            currentVisualStart = (DateTime)args.CurrentRange[0];
            currentVisualEnd = (DateTime)args.CurrentRange[1];
        }
    }

    void PanLeft() {
        if (chart is null)
            return;

        var visibleTicks = (currentVisualEnd - currentVisualStart).Ticks;
        var shiftTicks = (long)(visibleTicks * PanStepFraction);

        var newStart = currentVisualStart.AddTicks(-shiftTicks);
        var newEnd = currentVisualEnd.AddTicks(-shiftTicks);

        if (newStart < dataMinDate) {
            newEnd = newEnd.AddTicks((dataMinDate - newStart).Ticks);
            newStart = dataMinDate;
        }

        chart.SetArgumentAxisVisualRange([newStart, newEnd]);
    }

    void PanRight() {
        if (chart is null)
            return;

        var visibleTicks = (currentVisualEnd - currentVisualStart).Ticks;
        var shiftTicks = (long)(visibleTicks * PanStepFraction);

        var newStart = currentVisualStart.AddTicks(shiftTicks);
        var newEnd = currentVisualEnd.AddTicks(shiftTicks);

        if (newEnd > dataMaxDate) {
            newStart = newStart.AddTicks(-(newEnd - dataMaxDate).Ticks);
            newEnd = dataMaxDate;
        }

        chart.SetArgumentAxisVisualRange([newStart, newEnd]);
    }

    void ZoomIn() {
        if (chart is null)
            return;

        var visibleTicks = (currentVisualEnd - currentVisualStart).Ticks;
        var minTicks = TimeSpan.FromDays(MinVisibleSpanDays).Ticks;
        if (visibleTicks <= minTicks)
            return;

        var zoomedTicks = (long)(visibleTicks * ZoomFactor);
        if (zoomedTicks < minTicks)
            zoomedTicks = minTicks;

        var center = currentVisualStart.AddTicks(visibleTicks / 2);
        var newStart = center.AddTicks(-zoomedTicks / 2);
        var newEnd = center.AddTicks(zoomedTicks / 2);

        if (newStart < dataMinDate) newStart = dataMinDate;
        if (newEnd > dataMaxDate) newEnd = dataMaxDate;

        chart.SetArgumentAxisVisualRange([newStart, newEnd]);
    }

    void ZoomOut() {
        if (chart is null)
            return;

        var visibleTicks = (currentVisualEnd - currentVisualStart).Ticks;
        var totalTicks = (dataMaxDate - dataMinDate).Ticks;
        if (visibleTicks >= totalTicks)
            return;

        var zoomedTicks = (long)(visibleTicks / ZoomFactor);
        if (zoomedTicks > totalTicks)
            zoomedTicks = totalTicks;

        var center = currentVisualStart.AddTicks(visibleTicks / 2);
        var newStart = center.AddTicks(-zoomedTicks / 2);
        var newEnd = center.AddTicks(zoomedTicks / 2);

        if (newStart < dataMinDate) {
            newEnd = newEnd.AddTicks((dataMinDate - newStart).Ticks);
            newStart = dataMinDate;
        }
        if (newEnd > dataMaxDate) {
            newStart = newStart.AddTicks(-(newEnd - dataMaxDate).Ticks);
            newEnd = dataMaxDate;
        }
        if (newStart < dataMinDate) newStart = dataMinDate;

        chart.SetArgumentAxisVisualRange([newStart, newEnd]);
    }

    void ResetZoom() {
        if (chart is null)
            return;

        chart.SetArgumentAxisVisualRange([startDate, endDate]);
    }
}