Zoom in Blazor Chart
- 7 minutes to read
<DxChart> supports the following zoom and pan operations:
- Zoom in / out (mouse wheel, zoom/pinch gestures)
- Zoom in to a specific area (select a rectangle with the mouse)
- Pan (mouse and scrollbar, swipe gestures)
The DxChartZoomAndPanSettings object configures zoom and pan options. You can specify them separately for argument and value axes: ArgumentAxisZoomAndPanMode and ValueAxisZoomAndPanMode.
<DxChart Data="forecasts">
    <DxChartAreaSeries ArgumentField="@((WeatherForecast v) => v.Date)"
                       ValueField="@((WeatherForecast v) => v.TemperatureC)" />
    <DxChartZoomAndPanSettings ArgumentAxisZoomAndPanMode="ChartAxisZoomAndPanMode.Zoom"
                               ValueAxisZoomAndPanMode="ChartAxisZoomAndPanMode.Pan" />
</DxChart>
To disable the mouse wheel or touch gestures, set the AllowMouseWheel or AllowTouchGestures property to false. The following example disables zoom operations initiated by the mouse wheel. Note that you can implement an alternative method to zoom and pan chart data (examples at the end of this article).
<DxChart Data="forecasts">
    <DxChartAreaSeries ArgumentField="@((WeatherForecast v) => v.Date)"
                       ValueField="@((WeatherForecast v) => v.TemperatureC)" />
    <DxChartZoomAndPanSettings ArgumentAxisZoomAndPanMode="ChartAxisZoomAndPanMode.Both"
                               ValueAxisZoomAndPanMode="ChartAxisZoomAndPanMode.Both"
                               AllowMouseWheel="false" />
</DxChart>
When a user zooms or pans the chart, axis visual ranges change. You can react to these changes using the VisualRangeChanged event. See the corresponding section below: React to Visual Range Changes.
You can also modify visual ranges in code using the following methods:
- ResetVisualRange()
- Resets visual ranges for all axes to match the data range.
- SetArgumentAxisVisualRange(List<Object>)
- Applies a specific visual range to the argument axis.
- SetValueAxisVisualRange(List<Object>, String)
- Applies a specific visual range to a value axis.
Zoom Area
The Chart component allows users to zoom a specific area. When a user marks the area with the mouse, the chart displays a “drag box”.
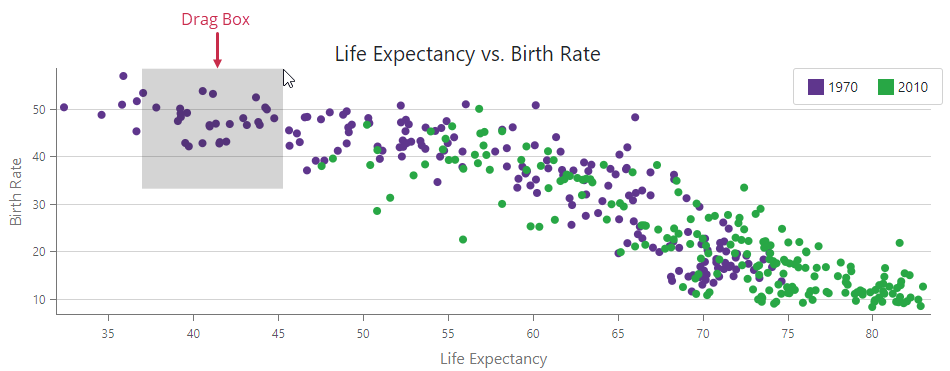
To enable the drag box, set the AllowDragToZoom property to true. In this configuration, clicks on the chart area initiate selection operations. To start a pan operation instead, drag the mouse while pressing the PanKey (the default key is Shift).
You can use the DxChartZoomAndPanDragBoxStyle object to customize the opacity and color of the drag box.
The following code snippet colors the drag box purple and sets the opacity value to 0.8:
<DxChart Data="@DataSource"
         Width="100%">
    <DxChartTitle Text="Life Expectancy vs. Birth Rate" />
    <DxChartLegend Position="RelativePosition.Inside"
                    VerticalAlignment="VerticalEdge.Top"
                    HorizontalAlignment="HorizontalAlignment.Right" />
    <DxChartScatterSeries ArgumentField="@((BirthLife i) => i.LifeExp)"
                            ValueField="@((BirthLife i) => i.BirthRate)"
                            Filter="@((BirthLife i) => i.Year == 1970)"
                            Name="1970">
        <DxChartSeriesPoint Size="8" />
    </DxChartScatterSeries>
    <DxChartScatterSeries ArgumentField="@((BirthLife i) => i.LifeExp)"
                          ValueField="@((BirthLife i) => i.BirthRate)"
                          Filter="@((BirthLife i) => i.Year == 2010)"
                          Name="2010">
        <DxChartSeriesPoint Size="8" />
    </DxChartScatterSeries>
    <DxChartArgumentAxis>
        <DxChartAxisTitle Text="Life Expectancy" />
    </DxChartArgumentAxis>
    <DxChartValueAxis>
        <DxChartAxisTitle Text="Birth Rate" />
    </DxChartValueAxis>
    <DxChartTooltip Enabled="true">
        <div class="tooltip-content">
            <div>@(((BirthLife)context.Point.DataItems.First()).Country)
                 @(((BirthLife)context.Point.DataItems.First()).Year)</div>
        </div>
    </DxChartTooltip>
    <DxChartZoomAndPanSettings ArgumentAxisZoomAndPanMode="ChartAxisZoomAndPanMode.Both"
                               ValueAxisZoomAndPanMode="ChartAxisZoomAndPanMode.Both"
                               AllowDragToZoom="true"
                               AllowMouseWheel="true"
                               PanKey="ChartEventPanKey.Shift">
        <DxChartZoomAndPanDragBoxStyle Color="var(--dxds-utility-purple-50)"
                                       Opacity="0.8" />
    </DxChartZoomAndPanSettings>
</DxChart>

@code {
    IEnumerable<BirthLife> DataSource = Enumerable.Empty<BirthLife>();
    protected override void OnInitialized() {
        DataSource = ChartBirthLifeDataProvider.GenerateData();
    }
}
Scroll Bar
You can add a scroll bar to the chart. It always aligns with the argument axis.
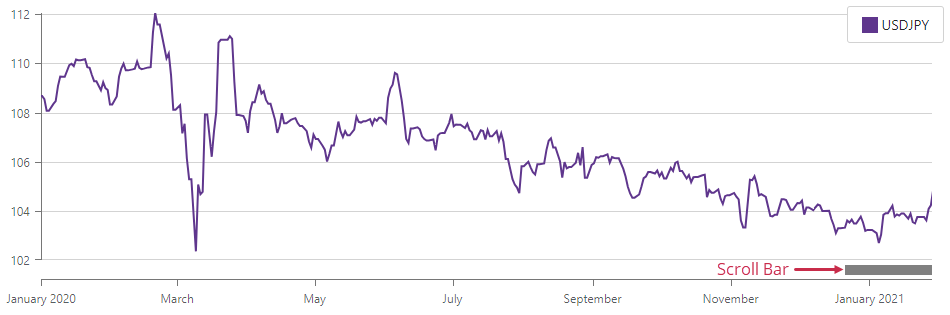
Declare a DxChartScrollBarSettings object and set its ArgumentAxisScrollBarVisible property to true to display a scroll bar. Use the ArgumentAxisScrollBarPosition property to specify whether the scroll bar is above (Top) or below (Bottom) the chart area. If your chart is rotated, use Right and Left enumeration values to position the scroll bar.
@using Chart.Data

<DxChart Data="@SalesData">
    <DxChartLineSeries Name="2017"
                       Filter="@((SaleInfo s) => s.Date.Year == 2017)"
                       ArgumentField="@(s => s.Date)"
                       ValueField="@(s => s.Amount)">
        <DxChartAggregationSettings Enabled="true" Method="ChartAggregationMethod.Sum" />
    </DxChartLineSeries>
    <DxChartZoomAndPanSettings ArgumentAxisZoomAndPanMode="ChartAxisZoomAndPanMode.Both"
                               ValueAxisZoomAndPanMode="ChartAxisZoomAndPanMode.Pan" />
    <DxChartScrollBarSettings ArgumentAxisScrollBarVisible="true"
                              ArgumentAxisScrollBarPosition="ChartScrollBarPosition.Top" />
</DxChart>

@code {
    IEnumerable<SaleInfo> SalesData;

    protected override async Task OnInitializedAsync() {
        SalesData = await Sales.GetSalesAsync();
    }
}
Performance Optimization
When a user zooms or pans the chart area, the Chart component recalculates axis values and rotates overlapped labels. To optimize performance, do one of the following:
- Set the DisplayMode property to
Rotate(rotate all labels). - Set the Overlap property to
Hide(hide overlapping labels).
You can also enable data aggregation to optimize chart performance while zooming. Declare a DxChartAggregationSettings object, set its Enabled property to true, and specify the aggregation Method:
<DxChart Data="@DataSource">
    <DxChartLineSeries T="BargainDataPoint"
                       TArgument="DateTime"
                       TValue="double"
                       ArgumentField="i => i.DateTimeStamp"
                       ValueField="i => i.Price"
                       Name="USDJPY">
        <DxChartAggregationSettings Enabled="true"
                                    Method="ChartAggregationMethod.Average" />
    </DxChartLineSeries>
    @* ... *@
</DxChart>
You can specify the following aggregation-related properties for the argument axis:
- AggregationInterval
- Specifies the width of aggregation intervals in axis units. Applies only to axes of continuous and logarithmic types.
- AggregationGroupWidth
- Specifies the width of aggregation intervals in pixels. Applies only to axes of continuous and logarithmic types.
- AggregatedPointPosition
- Specifies where aggregated series points appear relative to major tick marks. Applies only to axes of continuous and logarithmic types.
React to Visual Range Changes
The VisualRangeChanged event fires in the following cases:
- Users zoom or pan the chart.
- You apply specific visual ranges to axes using SetArgumentAxisVisualRange and SetValueAxisVisualRange methods.
- You reset visual ranges for all axes using the ResetVisualRange method.
The following code snippet shows information about visual range changes only when a user pans the chart along the value axis:
@inject ICurrencyExchangeDataProvider UsdJpyDataProvider

<DxChart @ref="@chart"
         T="DatePricePoint"
         Data="@UsdJpyData"
         VisualRangeChanged="@OnVisualRangeChanged"
         Width="100%">
    <DxChartLineSeries T="DatePricePoint"
                       TArgument="DateTime"
                       TValue="double"
                       ArgumentField="i => i.DateTimeStamp"
                       ValueField="i => i.Price"
                       Name="USDJPY">
        <DxChartSeriesPoint Visible="false" />
        <DxChartAggregationSettings Enabled="true"
                                    Method="ChartAggregationMethod.Average" />
    </DxChartLineSeries>
    <DxChartArgumentAxis>
        <DxChartAxisRange StartValue="startDate"
                          EndValue="endDate" />
    </DxChartArgumentAxis>
    <DxChartZoomAndPanSettings ValueAxisZoomAndPanMode="ChartAxisZoomAndPanMode.Both"
                                ArgumentAxisZoomAndPanMode="ChartAxisZoomAndPanMode.Both"/>
    <DxChartScrollBarSettings ArgumentAxisScrollBarVisible="true"
                              ArgumentAxisScrollBarPosition="ChartScrollBarPosition.Bottom" />
</DxChart>

@code {
    IEnumerable<DatePricePoint> UsdJpyData;
    DxChart<DatePricePoint> chart;

    DateTime startDate = new DateTime(2020, 01, 01);
    DateTime endDate = new DateTime(2021, 01, 29);

    void OnVisualRangeChanged(ChartVisualRangeChangedEventArgs args) {
        if (!args.IsArgumentAxis && args.ChangeSource == ChartVisualRangeChangeSource.ZoomAction) {
            var previousRange = args.PreviousRange;
            var currentRange = args.CurrentRange;
            ShowDetailDialog(previousRange, currentRange);
        }
    }
    // ...

    protected override async Task OnInitializedAsync() {
        UsdJpyData = await UsdJpyDataProvider.GetDataAsync();
    }
}
Task-Based Examples
This section contains code samples that demonstrate zoom functionality.
Set Initial Zoom Settings
Use the DxChartAxisRange object to specify the argument axis visual range and initially show a specific part of the chart area.
To set the range, use one of the following options:
- Specify both StartValue and EndValue properties.
- Specify Length and StartValue / EndValue properties.
- Specify the Length property only. When you leave StartValue and EndValue properties unspecified, the chart component uses the last axis value as the end value.
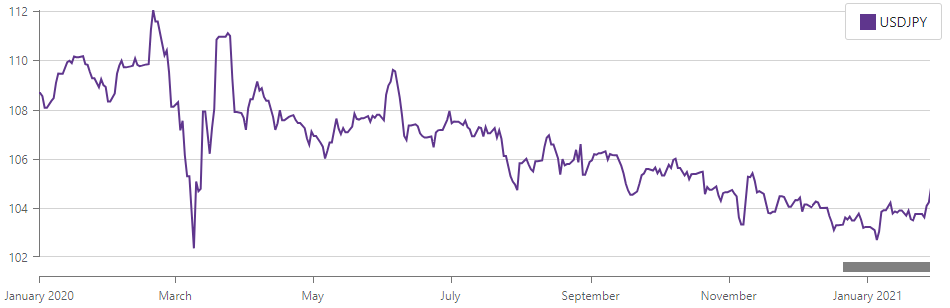
The following example displays data from the January 1, 2020 to January 29, 2021 at the first render:
<DxChart Data="@UsdJpyData">
    <DxChartLineSeries T="DatePricePoint"
                       TArgument="DateTime"
                       TValue="double"
                       ArgumentField="i => i.DateTimeStamp"
                       ValueField="i => i.Price"
                       Name="USDJPY">
        <DxChartSeriesPoint Visible="false" />
        <DxChartAggregationSettings Enabled="true"
                                    Method="ChartAggregationMethod.Average" />
    </DxChartLineSeries>
    <DxChartArgumentAxis>
        <DxChartAxisRange StartValue="new DateTime(2020, 01, 01)"
                          EndValue="new DateTime(2021, 01, 29)" />
    </DxChartArgumentAxis>
    <DxChartZoomAndPanSettings ArgumentAxisZoomAndPanMode="ChartAxisZoomAndPanMode.Both" />
    <DxChartScrollBarSettings ArgumentAxisScrollBarVisible="true"
                              ArgumentAxisScrollBarPosition="ChartScrollBarPosition.Bottom" />
</DxChart>