How to: Show a Regression Line for a Stock Chart (Runtime Sample)
This example demonstrates how a Regression Line can be displayed for a series of the Stock view type.
To access the series’ collection of indicators (via the XYDiagram2DSeriesViewBase.Indicators property), you should cast your series view to an appropriate type.
// Create a regression line for the Open value level.
RegressionLine myLine = new RegressionLine(ValueLevel.Open);

// Access the series collection of indicators,
// and add the regression line to it.
((StockSeriesView)chartControl1.Series[0].View).Indicators.Add(myLine);

// Customize the regression line's appearance.
myLine.LineStyle.DashStyle = DashStyle.DashDot;
myLine.LineStyle.Thickness = 2;
myLine.Color = Color.Crimson;
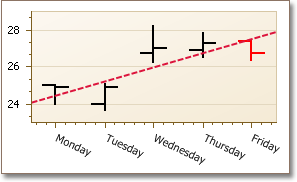
The result is shown in the following image.
See Also