How to: Add Titles to a Chart
- 2 minutes to read
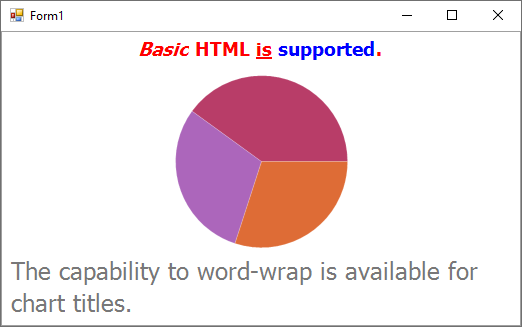
This example demonstrates how to create and customize chart titles at runtime.
using System;
using System.Drawing;
using System.Windows.Forms;
using DevExpress.Drawing;
using DevExpress.XtraCharts;

namespace WindowsApplication25 {
    public partial class Form1 : Form {
        public Form1() {
            InitializeComponent();
        }

        private void Form1_Load(object sender, EventArgs e) {
            // Create chart titles.
            ChartTitle chartTitle1 = new ChartTitle();
            ChartTitle chartTitle2 = new ChartTitle();

            // Define the text for the titles.
            chartTitle1.Text = "<i>Basic</i> <b>HTML</b> <u>is</u> <color=blue>supported</color>.";
            chartTitle2.Text = "The capability to word-wrap is available for chart titles.";

            chartTitle2.WordWrap = true;
            chartTitle2.MaxLineCount = 2;

            // Define the alignment of the titles.
            chartTitle1.Alignment = StringAlignment.Center;
            chartTitle2.Alignment = StringAlignment.Near;

            // Place the titles where it's required.
            chartTitle1.Dock = ChartTitleDockStyle.Top;
            chartTitle2.Dock = ChartTitleDockStyle.Bottom;

            // Customize a title's appearance.
            chartTitle1.EnableAntialiasing = DevExpress.Utils.DefaultBoolean.True;
            chartTitle1.DXFont = new DXFont("Tahoma", 14, DXFontStyle.Bold);
            chartTitle1.TextColor = Color.Red;
            chartTitle1.Indent = 10;

            // Add the titles to the chart.
            chartControl1.Titles.AddRange(new ChartTitle[] {
                chartTitle1,
                chartTitle2});
        }
    }
}
The result is shown in the following image.
See Also