How to: Create a Multi-Pane Chart
- 3 minutes to read
The following example demonstrates how to create a chart with multiple series placed in separate panes.
For the purpose of simplicity, in this tutorial, data for the chart’s series is set manually. However, in the real-life charts, it’s possible to use any other type of a datasource.
This topic consists of the following sections:
Create a Chart and Provide Its Data
- Start Microsoft Visual Studio, and create a new Windows Forms Application, or open an existing one.
Drop the ChartControl onto the form. Note that in this instance the Chart Wizard may be invoked (in case its “Show wizard every time a new chart is added” option is enabled). In this example, we don’t need to use the wizard, so click the Cancel button to close the wizard’s window and manually customize the ChartControl.
Note
To fit the ChartControl on the form in which it is contained, set its Dock property to Fill.
In the Properties window, locate the Series item and click its ellipsis button. The Series Collection Editor dialog will be invoked.
In this dialog, click Add…, to create a new series of the bar view type. Then, click Copy two times, to create two more similar series.
Define the data for these series as shown in the following table.
Argument Series 1 value Series 2 value Series 3 value 1 1 3 2 2 2 1 3 3 3 2 1 To apply the changes, click Close.

Create and Customize Panes
Select the Series2 element in the chart. Then, invoke the drop-down list of the Series2.View.Pane property, and click the New Pane button there. Now, a new pane (named Pane1) is created and the selected series is placed on it.

Repeat this procedure for the Series3, so that it is placed in the Pane2.
- Select the DefaultPane element, and set its
Weightproperty to 1.5, GridPaneLayout.Direction to Horizontal, XYDiagram.Rotated to true and XYDiagram2D.PaneDistance to 5. Select the Axis X element. In the Property window, locate the VisibleInPanes property and click its ellipsis button. In the invoked Axis Visibility dialog, check DefaultPane, so that only the current axis is shown in it.

Also, for the AxisX, you can set the Axis.Reverse property to true, so that arguments are displayed descending from top to bottom.
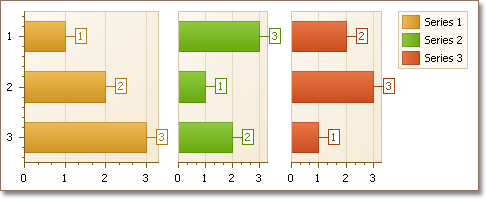
Get the Result
The complete chart is shown in the following image.