Summaries
- 5 minutes to read
Summaries are grid items that utilize aggregate functions to display summary information about displayed data: total record count, minimum values, etc.
Summary Types
Total Summary
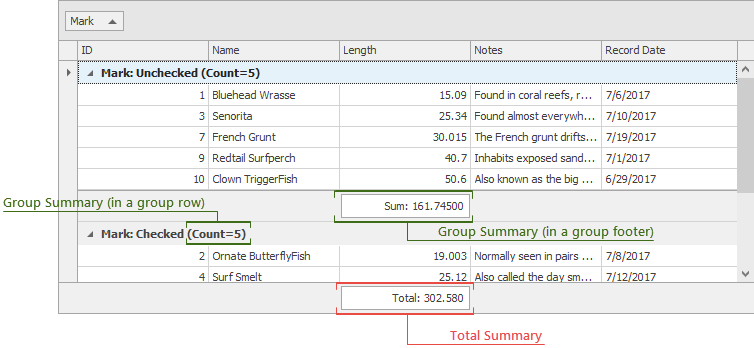
Total summaries (GridSummaryItem) are calculated over all Data Grid records and displayed within the view footer. Enable the View’s OptionsView.ShowFooter setting to display the view footer.
Group Summary
Group summaries (GridGroupSummaryItem) are calculated over individual groups and displayed either in a group footer area or within group rows.
Aggregation Functions
Use the SummaryType property to specify the aggregation function. You can specify the built-in function (SUM, MIN, MAX, COUNT, AVG) or handle the CustomSummaryCalculate event to calculate summaries manually.
Total Summaries
When the view footer is visible, end-users can right-click it and use a context menu to add and remove summary items. It is also possible to right-click existing summaries to change their aggregate functions.
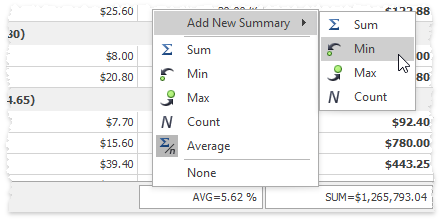
GridOptionsMenu.EnableFooterMenu - specifies whether or not end-users can invoke the view footer context menu.
GridColumn.AllowSummaryMenu - if disabled, end-users are able to create only “Count” summaries for this column. Other aggregate functions are disabled.
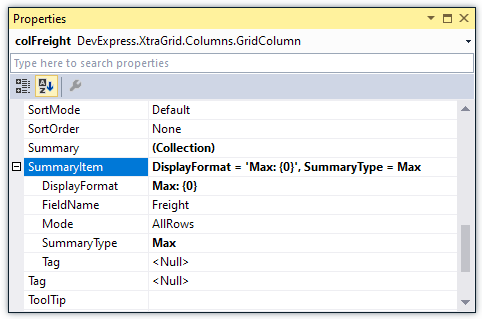
At design time, modify the column GridColumn.SummaryItem property to add a single summary item for this column.
-
Specifies the aggregate function for this summary item. If you choose “Custom”, you need to handle the GridView.CustomSummaryCalculate event to manually calculate a summary item value. Note that this event is not raised in Server Mode. See the Working with Summaries in Code. Custom Summaries article to learn more about custom summaries.
-
Specifies a data source field whose values this summary item processes. This allows you to display summaries that process values of one column below another column.
-
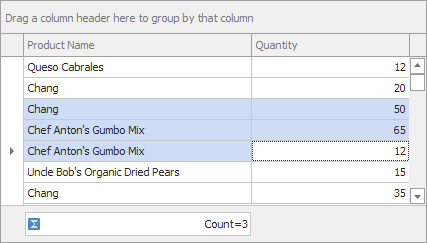
Gets or sets whether to calculate the current summary against all rows or the selection. Use this property when you enable multiple row selection (see ColumnView.OptionsSelection.MultiSelect). This property is not supported in server mode.
-
Applies value formatting according to the “<custom static text>{0<:format specifier<precision specifier>>}<custom static text>” formula.
-
Stores any object that you want to associate with this item.
If you need more than one summary, click the ellipsis button against the GridColumn.Summary property in Visual Studio’s Property Grid and use the Collection Editor dialog to create summary items.
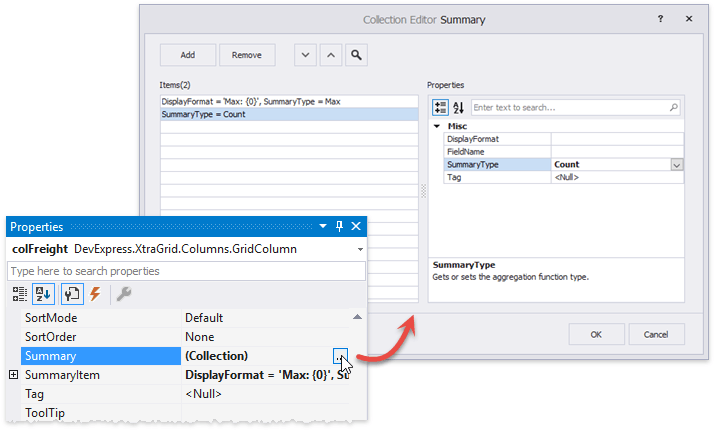
Refer to the Working with Summaries in Code. Custom Summaries article to learn how to add total summaries in code.
Demos
Group Summaries
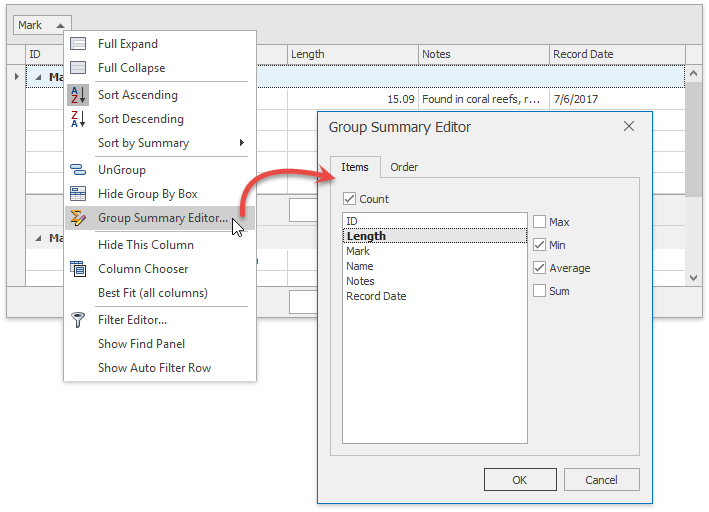
End-users can manually add and modify group summaries in two cases:
when the GridOptionsMenu.ShowGroupSummaryEditorItem is enabled. In this case, users can right-click a grouped column header to invoke a Group Summary Editor dialog.
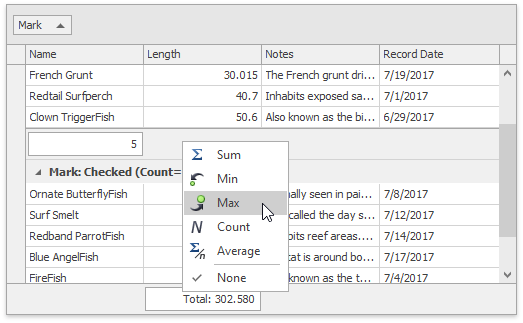
when the group footer is visible (either it already has a group summary item, or the GridOptionsView.GroupFooterShowMode property is set to VisibleAlways). End-users can right-click this footer below the required column and select a summary item type.
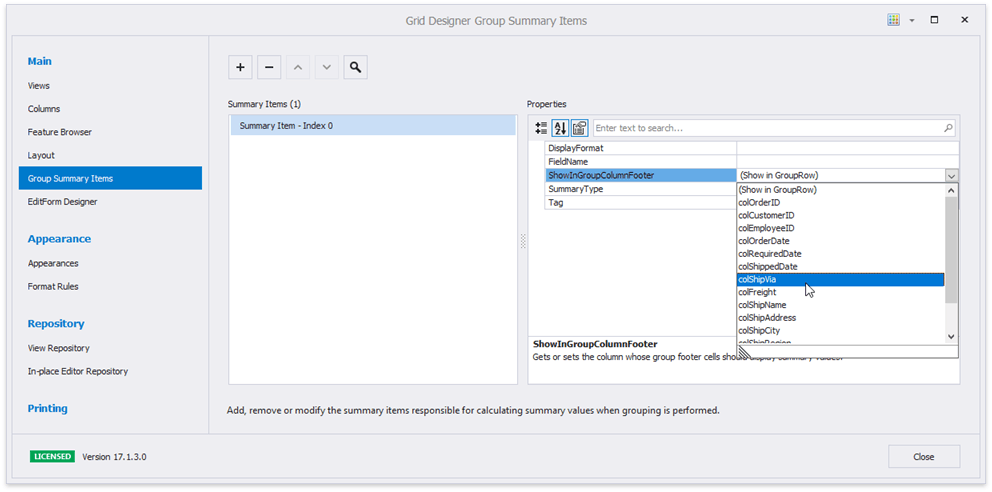
At design-time, invoke the Data Grid designer and switch to the “Main | Group Summary Items” tab. Use this designer page to add summary items and set up their properties. GridGroupSummaryItem objects provide the same settings as total summaries, plus one additional setting: the GridGroupSummaryItem.ShowInGroupColumnFooter property allows you to choose whether an item should be displayed in a group row or group footer.
If the GridOptionsBehavior.AlignGroupSummaryInGroupRow property is enabled, all summary items shown in group footers move to group rows below corresponding column headers.
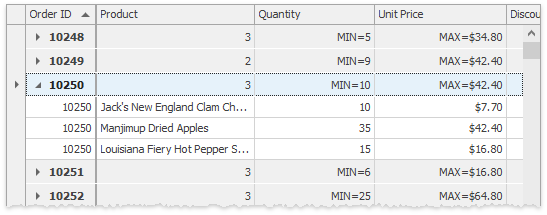
When you enable multiple row selection mode, the Data Grid can show summaries calculated against groups of rows in the footer.
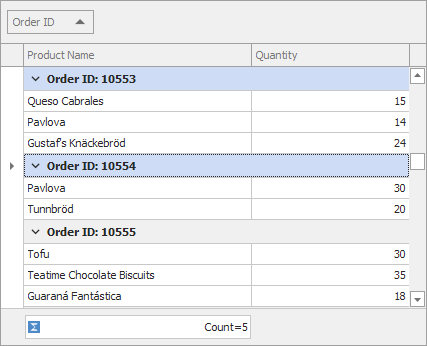
Refer to the GridSummaryItem.Mode topic for more information.
See the Working with Summaries in Code. Custom Summaries article to learn how to add group summaries in code.
Tip
When Data Grid data is grouped by multiple columns, handle the GridView.CustomSummaryExists event to avoid repeating summaries in group footers.
Sort Groups by Summary Values
When the Data Grid displays group summaries, end-users can right-click a column header in a group panel and select “Sort by Summary”. By doing so, users can sort groups by any group summary item, associated with any Data Grid column. When sorting by summaries is active, a dash is painted above the regular ascending/descending sort indicator in column headers.
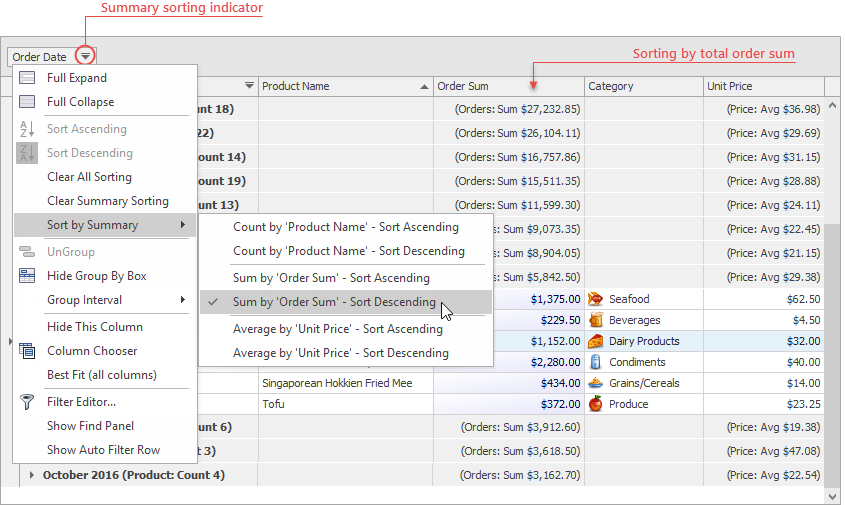
To disable the “Sort by Summary” menu item, set the GridOptionsMenu.ShowGroupSortSummaryItems property to false.
In code, add GroupSummarySortInfo objects into the GridView.GroupSummarySortInfo collection.
private void Form1_Load(object sender, EventArgs e) {
    // ...
    GridColumn firstGroupColumn = gridView.SortInfo[0].Column;
    GroupSummarySortInfo[] groupSummaryToSort = { new GroupSummarySortInfo(summaryItemMaxOrderSum, firstGroupColumn, ColumnSortOrder.Ascending) };
    gridView.GroupSummarySortInfo.ClearAndAddRange(groupSummaryToSort);
}
Note
The Data Grid does not automatically re-sort groups sorted by group summary values when these values change (when new rows are added to the Grid, or existing rows are modified or deleted). To update the group sorting order manually, call the ColumnView.RefreshData method.
Ignore Null Values
Enable the OptionsBehavior.SummariesIgnoreNullValues property to ignore cells with null values during summary calculations.