Oscillator Indicators
- 2 minutes to read
This document describes the Oscillator indicators used in financial charting.
An Oscillator is an indicator that fluctuates above and below a centerline or between set levels as its value changes over time.
For a 2D XY-series, you can show any number of trend indicators of the following types.
- Average True Range (ATR, AverageTrueRange)
- Commodity Channel Index (CCI, CommodityChannelIndex);
- Detrended Price Oscillator (DPO, DetrendedPriceOscillator);
- Moving Average Convergence/Divergence (MACD, MovingAverageConvergenceDivergence);
- Rate of Change (RoC, RateOfChange);
- Relative Strength Index (RSI, RelativeStrengthIndex);
- Chaikin’s Volatility (CHV, ChaikinsVolatility);
- Triple Exponential Moving Average (TriX, TripleExponentialMovingAverageTrix);
- Williams %R (%R, WilliamsR);
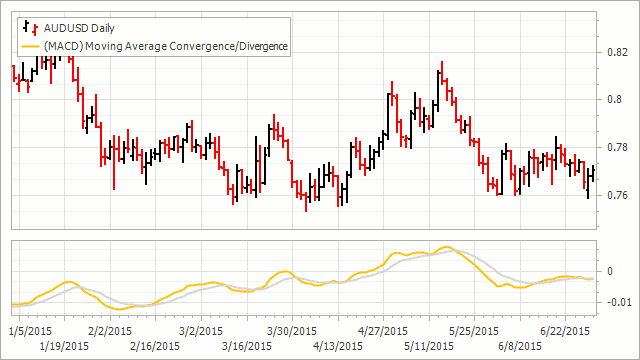
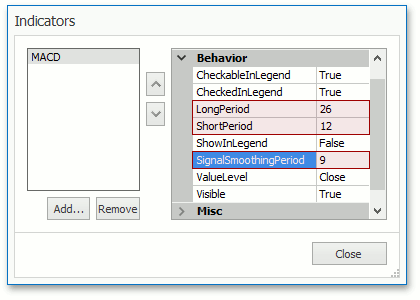
The following image demonstrates the MACD oscillator.
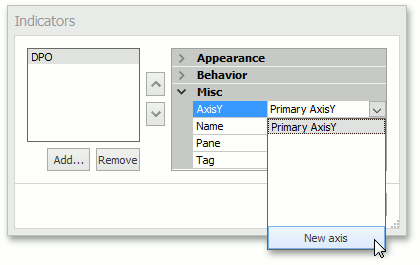
All oscillators can be displayed in a separate pane with a secondary Y-axis. For this, the SeparatePaneIndicator.Pane and SeparatePaneIndicator.AxisY properties should be specified.
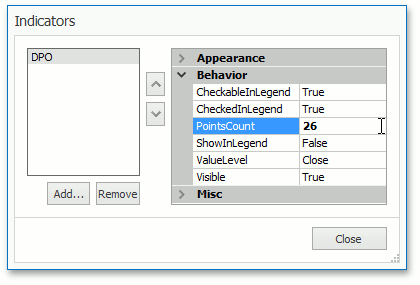
To calculate all oscillators, except MACD, several point values are used. To specify this point count, use the PointsCount property of the required indicator.
To calculate the MACD oscillator, several point counts are required: short, long and smoothing period. To configure these values, specify the MovingAverageConvergenceDivergence.ShortPeriod, MovingAverageConvergenceDivergence.LongPeriod and MovingAverageConvergenceDivergence.SignalSmoothingPeriod properties.
Note
For more information about indicator periods, refer to the MACD Wikipedia page.
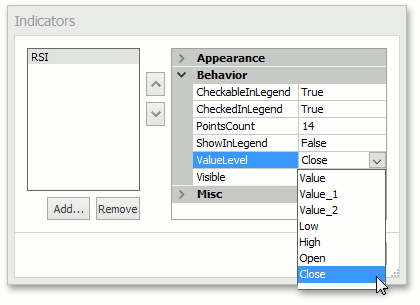
For the DPO, MACD, RoC, RSI and TriX oscillators, the financial series point value used to calculate an indicator can be specified. To do this, specify the ValueLevel property of the required indicator.