DataBarFormatCondition Class
Represents a data bar format condition.
Namespace: DevExpress.Xpf.PivotGrid
Assembly: DevExpress.Xpf.PivotGrid.v25.2.dll
NuGet Package: DevExpress.Wpf.PivotGrid
Declaration
Remarks
A data bar allows you to see a cell value relative to other cells. The bar length changes proportionally to a cell value. A longer bar corresponds to a higher value, and a shorter bar corresponds to a lower value.

The DataBarFormatCondition class is inherited from the FormatConditionBase base class and represents a data bar format condition. To apply conditional formatting, create a new DataBarFormatCondition instance, specify its parameters and add it to the PivotGridControl.FormatConditions collection.
By default, the minimum and maximum values in a data cells are calculated automatically. To manually specify the values to regard as the minimum and maximum, use the IndicatorFormatConditionBase.MinValue and IndicatorFormatConditionBase.MaxValue properties.
For each data bar condition, you can select one of the predefined formats or apply a custom data bar format.
- Use the FormatConditionBase.PredefinedFormatName property to select one of the predefined formats.
- To apply a custom data bar format, create a new DataBarFormat instance, specify data bar color using the DataBarFormat.Fill property and assign this instance to the DataBarFormatCondition.Format property. If data cells contain negative values, the negative bars are displayed by default. To manually set the negative color, use the DataBarFormat.FillNegative property.
Example
This example shows how to add format conditions to WPF Pivot Grid Control.
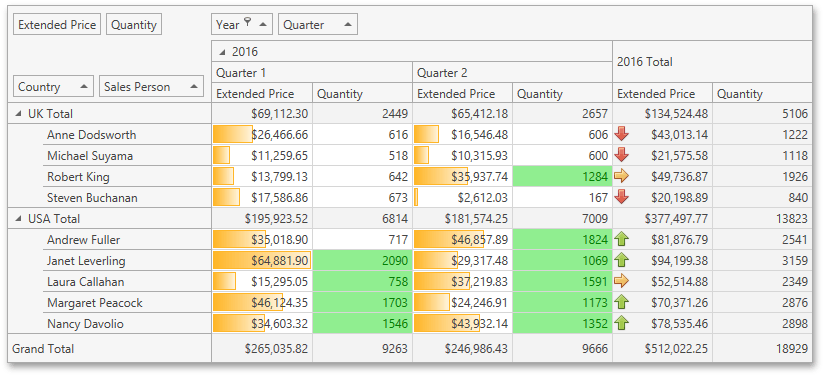
- The Data Bar conditional formatting is applied to the ‘Extended Price’ measure and intersection of the ‘Sales Person’ and ‘Quarter’ fields. This condition formats data cells with a predefined orange gradient data bar.
- The Top Bottom Rule conditional formatting is applied to the ‘Quantity’ measure and intersection of the ‘Sales Person’ and ‘Quarter’ fields. This condition formats data cells whose values are above average with green text and light green fill.
- The Icon Set conditional formatting is applied to the ‘Extended Price’ measure and intersection of the ‘Sales Person’ and ‘Year’ fields. This condition displays a specific icon in a cell according to the range to which this cell value belongs.
The image below shows the result.

using System.Windows;
using System;
using DevExpress.Xpf.PivotGrid;

namespace WpfPivotGridConditionalFormatting
{
    /// <summary>
    /// Interaction logic for MainWindow.xaml
    /// </summary>
    public partial class MainWindow : Window
    {
        public MainWindow()
        {
            InitializeComponent();

            FilterFieldValues(fieldYear, new int[]{2016}, FieldFilterType.Included);

            // Creates a new DataBarFormatCondition instance.
            DataBarFormatCondition formatRulesDataBar = new DataBarFormatCondition();

            // Adds this instance to the FormatConditionCollection.
            pivotGridControl1.AddFormatCondition(formatRulesDataBar);

            // Specifies a column field.
            formatRulesDataBar.ColumnName = "fieldQuarter";

            // Specifies a row field.
            formatRulesDataBar.RowName = "fieldSalesPerson";

            // Specifies a data field.
            formatRulesDataBar.MeasureName = "fieldExtendedPrice";

            // Applies the condition to intersection of row and column fields.
            formatRulesDataBar.ApplyToSpecificLevel = true;

            // Sets the predefined format.
            formatRulesDataBar.PredefinedFormatName = "OrangeGradientDataBar";


        }

        private void FilterFieldValues(PivotGridField field, int[] filterValues,
            FieldFilterType filterType)
        {
            pivotGridControl1.BeginUpdate();
            try
            {
                field.FilterValues.Clear();
                foreach (object filterValue in filterValues)
                    field.FilterValues.Add(filterValue);
            }
            finally
            {
                field.FilterValues.FilterType = filterType;
                pivotGridControl1.EndUpdate();
            }
        }
    }
}