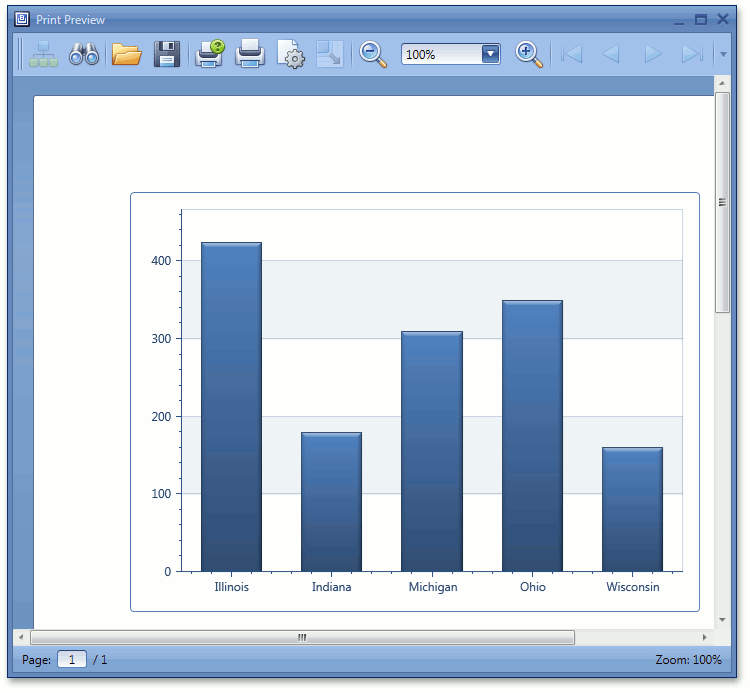
This example demonstrates how to print a ChartControl, or show its Print Preview.
To do this, you should use either the ChartControlBase.Print or ChartControlBase.ShowPrintPreview methods.
The Print Preview displays the chart as it will appear when printed. Note that the chart can be previewed and printed only if the DXPrinting Library is available.
The image below shows the print preview of a Chart control.

Imports Microsoft.VisualBasic
Imports System.Windows

Namespace PrintChart

    Partial Public Class Window1
        Inherits Window
        Public Sub New()
            InitializeComponent()
        End Sub

        Private Sub button_ShowPrintPreview(ByVal sender As Object, ByVal e As RoutedEventArgs)
            chartControl1.ShowPrintPreview(Me)
        End Sub

        Private Sub button_Print_Click(ByVal sender As Object, ByVal e As RoutedEventArgs)
            chartControl1.Print()
        End Sub
    End Class
End Namespace
<Window x:Class="PrintChart.Window1"
    xmlns="http://schemas.microsoft.com/winfx/2006/xaml/presentation"
    xmlns:x="http://schemas.microsoft.com/winfx/2006/xaml"
    xmlns:dxp="http://schemas.devexpress.com/winfx/2008/xaml/printing"
    xmlns:dxc="http://schemas.devexpress.com/winfx/2008/xaml/charts"
    Title="Window1" Height="508" Width="586">

    <Grid>
        <Grid.RowDefinitions>
            <RowDefinition Height="50"></RowDefinition>
            <RowDefinition></RowDefinition>
        </Grid.RowDefinitions>
        <Button Name="button_PrintPreview" Click="button_ShowPrintPreview" Grid.Row="0" Margin="0,0,325,0">Print Preview</Button>
        <Button Name="button_Print" Click="button_Print_Click" Grid.Row="0" Margin="324,0,1,0">Print a Chart</Button>
        <dxc:ChartControl Grid.Row="1" HorizontalAlignment="Left" Name="chartControl1">
            <dxc:ChartControl.Diagram>
                <dxc:XYDiagram2D>
                    <dxc:XYDiagram2D.Series>
                        <dxc:BarSideBySideSeries2D x:Name="Series1998" DisplayName="1998">
                            <dxc:BarSideBySideSeries2D.Label>
                                <dxc:SeriesLabel Indent="20" ConnectorThickness="1" Visible="False" />
                            </dxc:BarSideBySideSeries2D.Label>
                            <dxc:BarSideBySideSeries2D.Points>
                                <dxc:SeriesPoint Argument="Illinois" Value="423.721" />
                                <dxc:SeriesPoint Argument="Indiana" Value="178.719" />
                                <dxc:SeriesPoint Argument="Michigan" Value="308.845" />
                                <dxc:SeriesPoint Argument="Ohio" Value="348.555" />
                                <dxc:SeriesPoint Argument="Wisconsin" Value="160.274" />
                            </dxc:BarSideBySideSeries2D.Points>
                        </dxc:BarSideBySideSeries2D>
                    </dxc:XYDiagram2D.Series>
                </dxc:XYDiagram2D>
            </dxc:ChartControl.Diagram>
        </dxc:ChartControl>
    </Grid>
</Window>
using System.Windows;

namespace PrintChart {

    public partial class Window1 : Window {
        public Window1() {
            InitializeComponent();
        }

        private void button_ShowPrintPreview(object sender, RoutedEventArgs e) {
            chartControl1.ShowPrintPreview(this);
        }

        private void button_Print_Click(object sender, RoutedEventArgs e) {
            chartControl1.Print();
        }
    }
}
