Strips
- 6 minutes to read
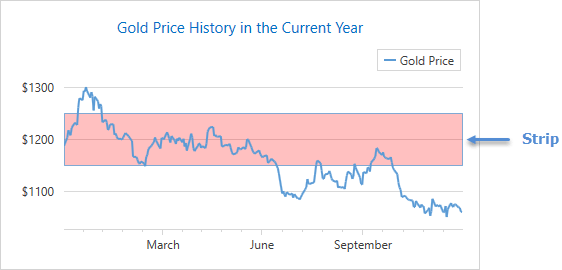
A strip is an area limited by two fixed values (minimum and maximum limits) on a corresponding axis.
How to Add a Strip
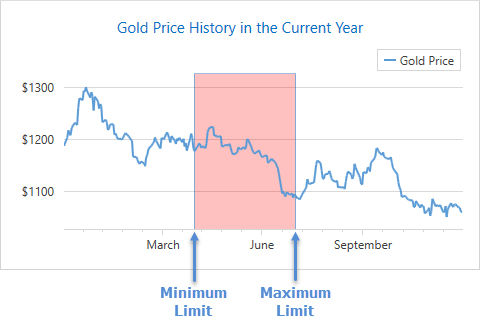
The Chart control enables you to add an unlimited number of strips to an x- or y-axis. To add a strip, you need to add a Strip object to the Axis2D.Strips collection and define the strip’s minimum and maximum limits. A strip does not display if the minimum limit is not less than the maximum limit, and it would occupy all available space in a diagram if these limits are not specified.
The XAML below shows how to add a strip to a chart:
<dxc:XYDiagram2D.AxisX>
     <dxc:AxisX2D>
          <dxc:AxisX2D.Strips>
               <dxc:Strip MinLimit="05/01/2015"
                          MaxLimit="08/01/2015"/>
          </dxc:AxisX2D.Strips>
     </dxc:AxisX2D>
     <!--...-->
</dxc:XYDiagram2D.AxisX>
The example above applies the following classes and properties:
| Class or Property | Description |
|---|---|
| Strip | A strip. |
| Axis2D.Strips | A collection that stores all strips of an axis. |
| Strip.MinLimit | A value specifying the strip’s minimum axis value. |
| Strip.MaxLimit | A value specifying the strip’s maximum axis value. |
Generate Strips from a ViewModel Collection (MVVM)
To generate custom strips from a ViewModel, bind an axis’s StripItemsSource to a collection of objects that contain strip settings. Then, use the Axis2D.StripItemTemplate or Axis2D.StripItemTemplateSelector property to specify how to display the generated strips.
<Window xmlns:dxc="http://schemas.devexpress.com/winfx/2008/xaml/charts"
        x:Class="ChartApp.MainWindow"
        xmlns="http://schemas.microsoft.com/winfx/2006/xaml/presentation"
        xmlns:x="http://schemas.microsoft.com/winfx/2006/xaml"
        xmlns:d="http://schemas.microsoft.com/expression/blend/2008"
        xmlns:mc="http://schemas.openxmlformats.org/markup-compatibility/2006"
        xmlns:local="clr-namespace:ChartApp"
        mc:Ignorable="d"
        Title="MainWindow" Height="450" Width="800">
    <Window.DataContext>
        <local:MainWindowViewModel/>
    </Window.DataContext>
    <Grid>
        <dxc:ChartControl DataSource="{Binding Data}">
            <dxc:XYDiagram2D x:Name="diagram">
                <dxc:BarSideBySideSeries2D DisplayName="Annual Statistics"
                                           ArgumentDataMember="Argument"
                                           ValueDataMember="Value" />
                <dxc:XYDiagram2D.AxisY>
                    <dxc:AxisY2D StripItemsSource="{Binding Strips}"
                                 LabelVisibilityMode="AutoGeneratedAndCustom"
                                 Interlaced="False">
                        <dxc:AxisY2D.StripItemTemplate>
                            <DataTemplate>
                                <dxc:Strip MinLimit="{Binding Value1}"
                                           MaxLimit="{Binding Value2}"
                                           AxisLabelText="{Binding Title}"/>
                            </DataTemplate>
                        </dxc:AxisY2D.StripItemTemplate>
                        <dxc:AxisY2D.NumericScaleOptions>
                            <dxc:ContinuousNumericScaleOptions GridSpacing="1"
                                                               AutoGrid="False"/>
                        </dxc:AxisY2D.NumericScaleOptions>
                    </dxc:AxisY2D>
                </dxc:XYDiagram2D.AxisY>
            </dxc:XYDiagram2D>
        </dxc:ChartControl>
    </Grid>
</Window>
using DevExpress.Xpf.Charts;
using System;
using System.Collections.ObjectModel;
using System.Windows;
using System.Windows.Media;

namespace ChartApp {
    public partial class MainWindow : Window {
        public MainWindow() {
            InitializeComponent();
        }
    }
    public class MainWindowViewModel {
        public ObservableCollection<DataPoint> Data { get; private set; }
        public ObservableCollection<StripData> Strips { get; private set; }
        public MainWindowViewModel() {
            this.Data = DataPoint.GetDataPoints();
            this.Strips = StripData.GetStripsData();
        }
    }
    public class DataPoint {
        public DateTime Argument { get; set; }
        public double Value { get; set; }
        public static ObservableCollection<DataPoint> GetDataPoints() {
            return new ObservableCollection<DataPoint> {
                new DataPoint { Argument = new DateTime(2022,01,01), Value = 9.289D},
                new DataPoint { Argument = new DateTime(2022,01,02), Value = 2.2727D},
                new DataPoint { Argument = new DateTime(2022,01,03), Value = 3.7257D},
                new DataPoint { Argument = new DateTime(2022,01,04), Value = 4.1825D},
                new DataPoint { Argument = new DateTime(2022,01,05), Value = 2.1172D},
                new DataPoint { Argument = new DateTime(2022,01,06), Value = 5.289D},
                new DataPoint { Argument = new DateTime(2022,01,07), Value = 3.74D},
                new DataPoint { Argument = new DateTime(2022,01,08), Value = 3.7257D},
                new DataPoint { Argument = new DateTime(2022,01,09), Value = 4.1825D},
                new DataPoint { Argument = new DateTime(2022,01,10), Value = 10.12D}
            };
        }
    }
    public class StripData {
        public double Value1 { get; set; }
        public double Value2 { get; set; }
        public string Title { get; set; }

        public static ObservableCollection<StripData> GetStripsData() {
            return new ObservableCollection<StripData> {
                new StripData {Value1 = 3, Value2 = 5, Title = "Strip #1"},
                new StripData {Value1 = 6, Value2 = 7, Title = "Strip #2"}
            };
        }
    }
}
How to Show a Strip in a Legend
You can display a marker with text that identifies a strip in a chart legend.
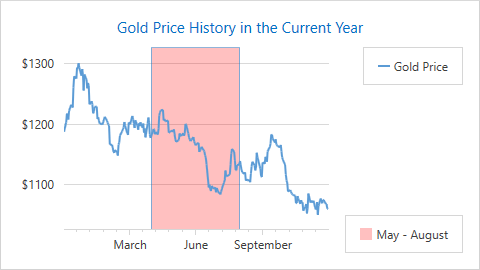
The following code example demonstrates how to show a strip marker with the specified text in the required legend:
<dxc:ChartControl.Legends>
      <dxc:Legend Name="seriesLegend"/>
      <dxc:Legend Name="stripLegend"
                  VerticalPosition="Bottom"/>
</dxc:ChartControl.Legends>
<!--...-->
<dxc:XYDiagram2D>
      <dxc:XYDiagram2D.AxisX>
            <dxc:AxisX2D>
                  <dxc:AxisX2D.Strips>
                        <dxc:Strip LegendText="May - August"
                                   Legend="{Binding ElementName=stripLegend}"
                                   MinLimit="05/01/2015"
                                   MaxLimit="08/31/2015"/>
                  </dxc:AxisX2D.Strips>
            </dxc:AxisX2D>
            <!--...-->
      </dxc:XYDiagram2D.AxisX>
</dxc:XYDiagram2D>
The markup above utilizes the following properties:
Property | Description |
|---|---|
Text displayed with a strip marker in a chart legend. If this property is not specified, a strip identifier does not show in the legend. | |
A legend that shows a strip identifier. |
How to Show a Specific Axis Label for a Strip
You can add a custom axis label for a strip as the following image shows:
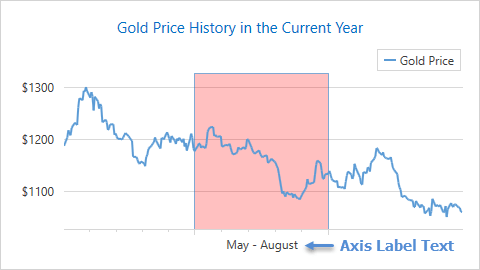
The Strip.AxisLabelText property allows you to specify axis label text for a strip:
<dxc:AxisX2D>
      <dxc:AxisX2D.Strips>
            <dxc:Strip AxisLabelText="May - August"
                       MinLimit="05/01/2015"
                       MaxLimit="08/31/2015"/>
      </dxc:AxisX2D.Strips>
</dxc:AxisX2D>
Tip
To simultaneously show auto-generated and custom axis labels, set the Axis2D.LabelVisibilityMode property to AutoGeneratedAndCustom.
How to Customize Strip Appearance
You can modify the default strip appearance to fulfill your requirements.
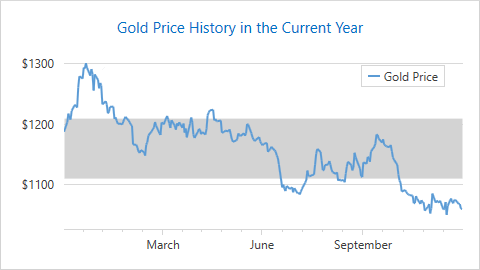
Using the following markup, you can configure a strip brush and its outline:
<dxc:AxisY2D>
      <dxc:AxisY2D.Strips>
            <dxc:Strip Brush="LightGray"
                       BorderColor="Transparent"
                       MinLimit="1150"
                       MaxLimit="1250"/>
      </dxc:AxisY2D.Strips>
      <!--...-->
</dxc:AxisY2D>
The example uses the following API members to configure strip appearance:
| Property | Description |
|---|---|
| Strip.Brush | A brush used to paint the strip. |
| Strip.BorderColor | A strip border color. |