TdxChartXYSeriesCustomView.AxisY Property
In This Article
Specifies the axis of values associated with the series.
#Declaration
Delphi
property AxisY: TdxChartCustomAxisY read; write;#Property Value
| Type | Description |
|---|---|
| Tdx |
The axis of values associated with the XY series View. |
#Remarks
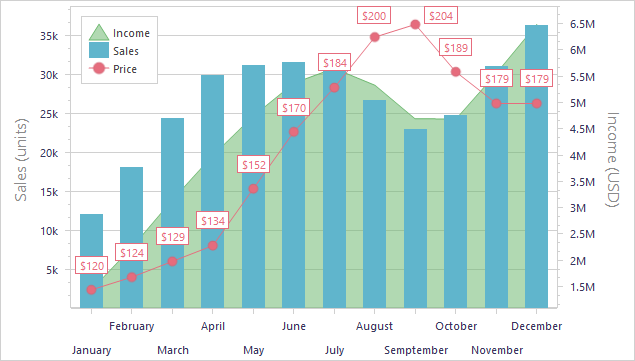
An XY diagram can display multiple secondary axes of values in addition to the main Y-axis. You can use the AxisY property to associate the series View with one of the axes of values displayed in the parent XY diagram. The Chart control uses the scale of the associated axis to display the series.
#Code Example
The following code example creates a secondary axis of values and associates it with the first series in an XY diagram:
var
  ADiagram: TdxChartXYDiagram;
  AAxisY: TdxChartSecondaryAxisYCollectionItem;
  AXYSeries: TdxChartXYSeries;
begin
  if dxChartControl1.DiagramCount = 0 then Exit;
  ADiagram := dxChartControl1.Diagrams[0] as TdxChartXYDiagram;
  if ADiagram.SeriesCount = 0 then Exit;
  AXYSeries := ADiagram.Series[0];
  AAxisY := ADiagram.SecondaryAxes.AxesY.Add;
  AXYSeries.View.AxisY := AAxisY.Axis;
  AAxisY.Title.Text := 'Income (USD)';
  AAxisY.Title.Alignment := TdxAlignment.Center;
  AAxisY.Appearance.Color := TdxAlphaColors.Gray;
end;
#Default Value
The AxisY property’s default value is the main axis of values in the parent XY diagram.
See Also